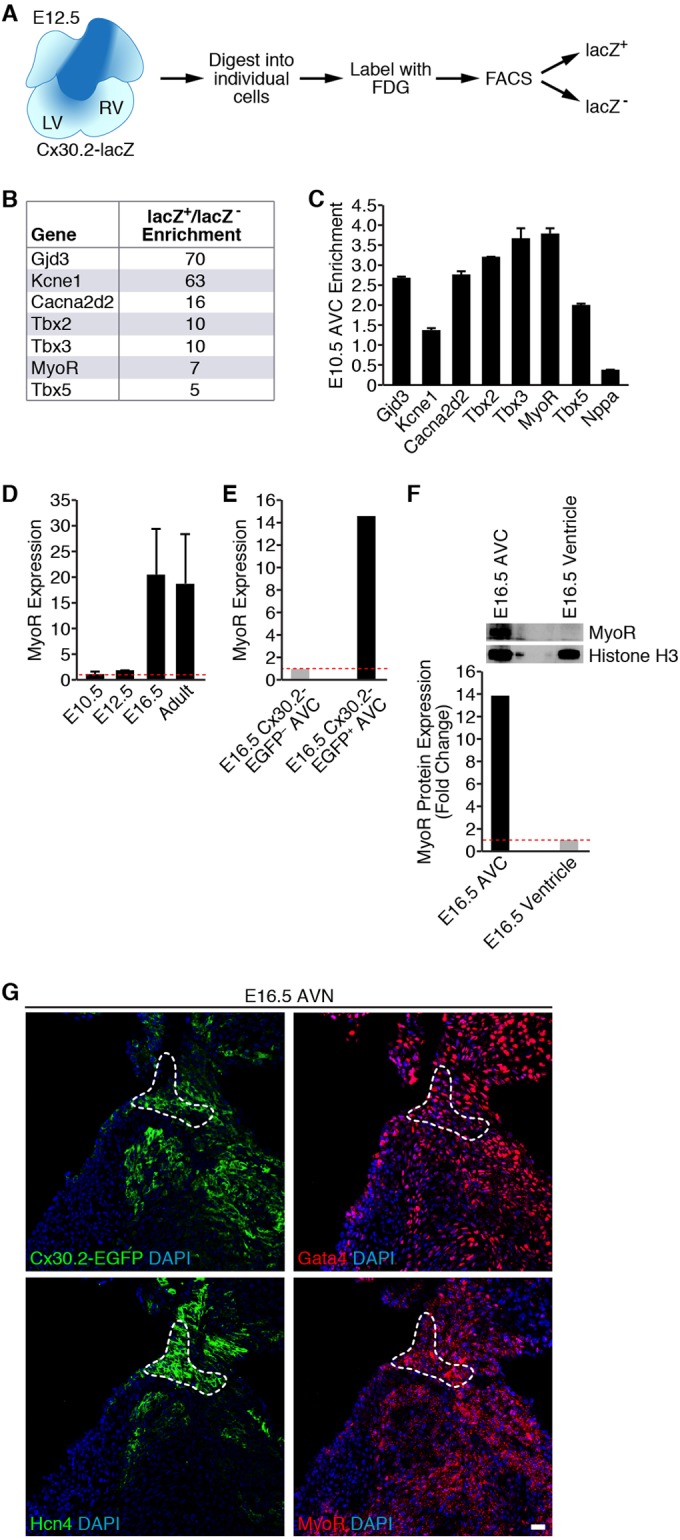
FIG 1.

Transcriptional profiling of Cx30.2-lacZ+ cells identifies MyoR as an AVC-enriched transcript. (A) Strategy used for purifying E12.5 Cx30.2-lacZ+ AVC cells by flow cytometry. (B) Partial list of genes found to be enriched in microarray analysis. Fold enrichment refers to transcript levels in Cx30.2-lacZ+ cells relative to lacZ-null cells. Note that MyoR transcripts were 7-fold more abundant in Cx30.2-lacZ+ cells within the E12.5 heart. (C) qRT-PCR analysis of microdissected E10.5 AVC tissue demonstrating enrichment of MyoR. Fold enrichment refers to transcript levels in dissected AVC tissue versus whole heart. (D) Developmental analysis of MyoR expression by qRT-PCR analysis. MyoR expression in the whole heart at a particular time point relative to E10.5 is shown. MyoR transcripts were found to peak during late gestation (E16.5). (E) qRT-PCR analysis of MyoR expression level in Cx30.2-EGFP+ AVC cells isolated at E16.5. MyoR expression is shown relative to transcript levels in EGFP− AVC cells. (F) Western blot analysis of AVC and ventricular nuclear extracts dissected from E16.5 embryos (top) with the indicated antibodies. Band quantitation and normalization demonstrated ∼14-fold enrichment of MyoR in the E16.5 AVC relative to ventricular tissue. (G) Immunostaining of consecutive sections through an E16.5 Cx30.2-EGFP heart for GFP, Gata4, Hcn4, and MyoR, demonstrating localization of Cx30.2, Gata4, and MyoR to the Hcn4+ AVN (dashed outline). All sections were counterstained with DAPI to stain cell nuclei. Scale bar, 20 μm. LV, left ventricle; RV, right ventricle; FDG, fluorescein digalactopyranoside; AVC, atrioventricular canal; AVN, atrioventricular node.
