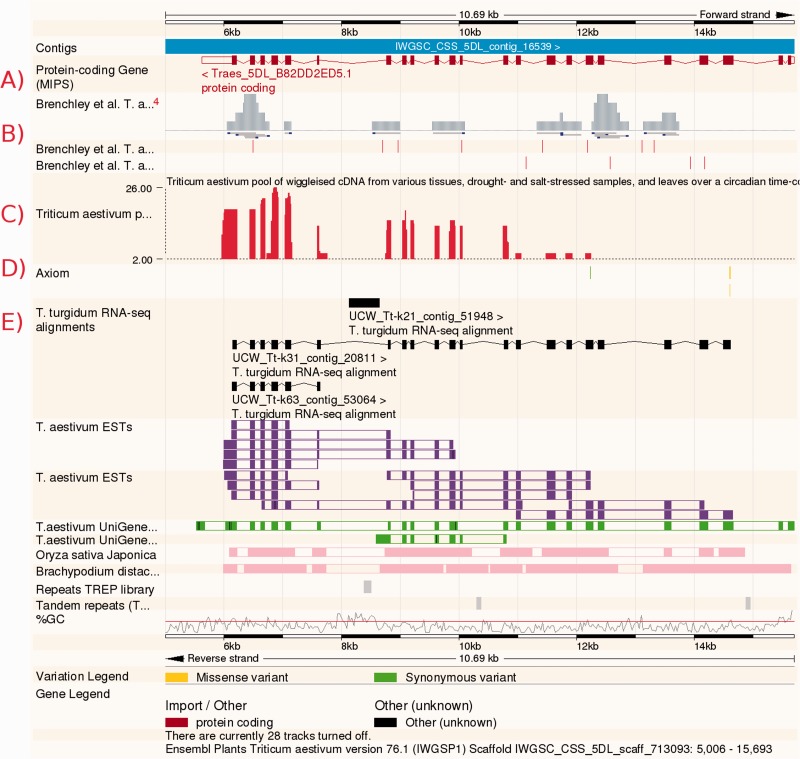
Fig. 1.
Visualizing the bread wheat genome through the Ensembl Genomes browser interface. The user can view many layers of genome annotation in a highly customizable way. Tracks shown include (A) gene models, (B) assemblies and interhomoeologous variations from Brenchley et al. (2012), (C) RNA-Seq data, (D) variations from the AXIOM array and (E) transcript assemblies from T. turgidum. Additional tracks are shown for T. aestivum ESTs and UniGenes (purple and green), alignment blocks to O. sativa and B. distachyon (pink), repeats (grey) and GC content.

