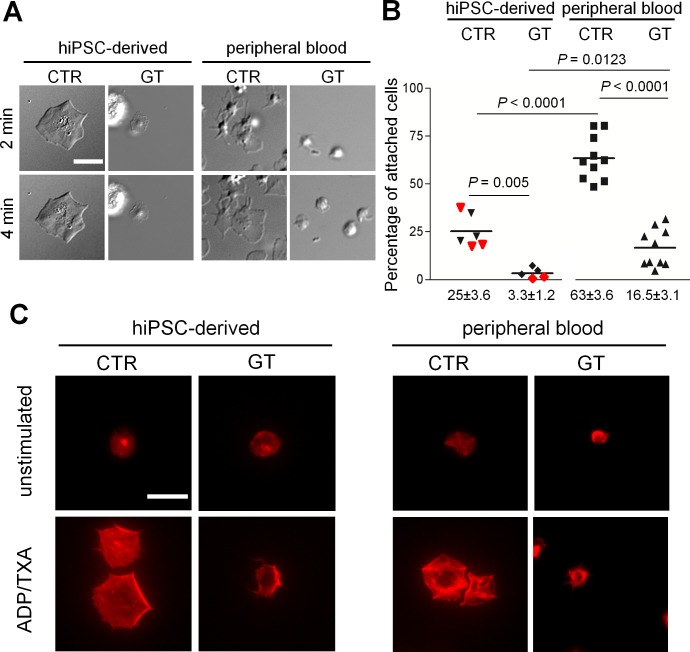
Figure 4. Surface spreading, adhesion and cytoskeleton rearrangement of peripheral blood and hiPSC-derived platelets.
(A) Platelets spreading on fibrinogen-coated wells were imaged with DICM in the presence of ADP/TXA2 at the indicated time points. For complete movie sequence see S1, S4, S5, S7 Movies. (B) Quantification of fibrinogen binding of MKs and platelets. The percentages of attached cells are shown as scatter columns with horizontal bars representing the mean. In the hiPSC-derived groups, red and black symbols indicate results from the two hiPSC clones. A total mean of 1991±262.6 cells per sample was counted before washing. P-values from unpaired t-tests; peripheral blood platelets from GT (n = 10) and CTR (n = 10); hiPSC-derived platelets from GT (n = 5) and CTR (n = 6). (C) Rhodamine-conjugated phalloidin was used to stain actin filaments after permeabilization of platelets spreading on fibrinogen. All cells shown stained positive for CD42b and negative for DAPI. All scale bars represent 10 μm. Representative images for each sample.

