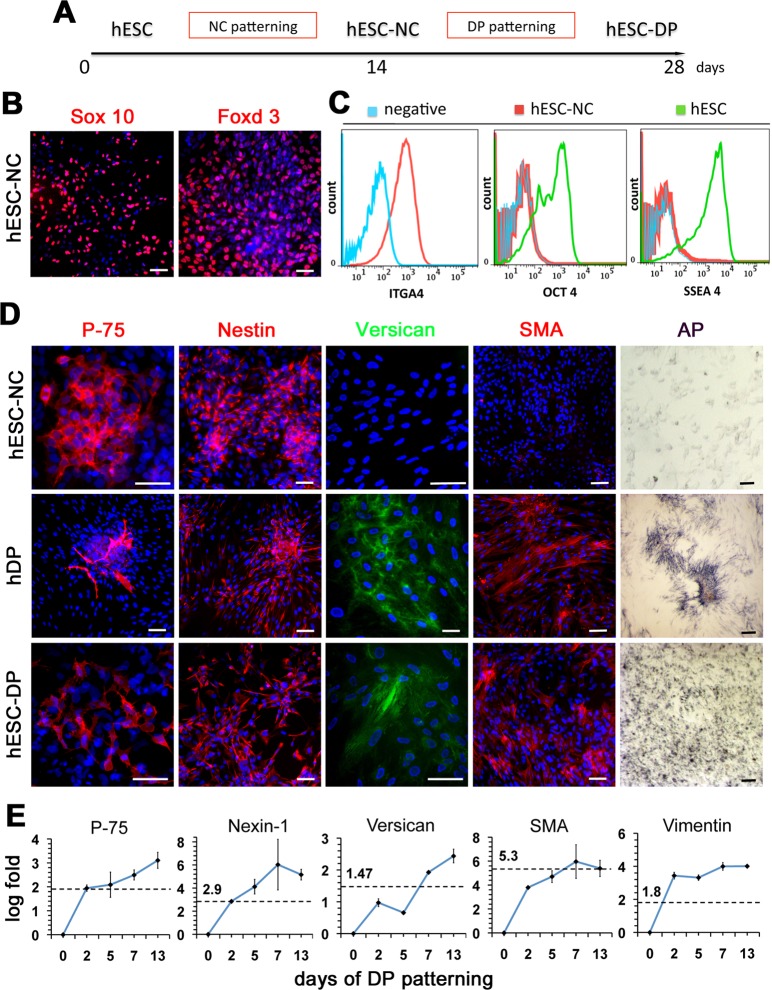
Figure 1. Differentiation of hESCs into DP-like cells via NC intermediate.
(A) Schematic representation of the differentiation strategy. (B) Expression of migratory NC markers Sox 10 and Foxd3, in hESC-NC cultures. Immunofluorescent staining, DAPI in blue. (C) Flow cytometry analysis of NC marker integrin alpha-4 (ITGA4) and hESC markers OCT4 and SSEA4 in hESC-NC cultures. (D) Expression of p-75, Nestin, Versican, SMA and Alkaline Phosphatase (AP) in hESC-NC, hDP (from normal skin) and hESC-DP cultures. Immunofluorescent staining, DAPI in blue. (E) Q-PCR analysis of hDP markers p-75, Nexin-1, Versican, SMA and Vimentin in hESC-DP cultures during DP patterning. Day 0 = hESC-NC cells. Levels of gene expression, shown as log of fold change over hESC-NC levels, were normalized to 18S. For each gene the dashed line represents levels of gene expression in hDP cell cultures. Scale bars 100 μm.

