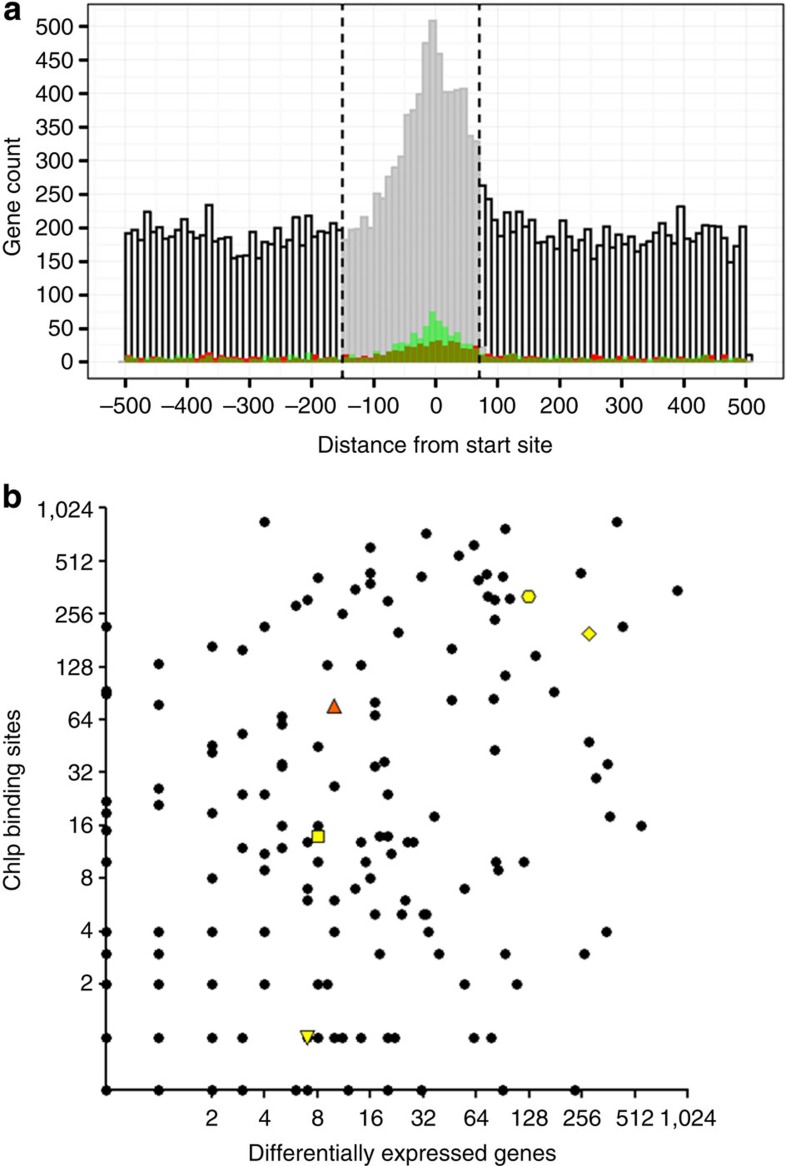
Figure 2. Global view of DNA-binding and transcriptional regulation in MTB.
(a) Plot of binding distribution in the 1-kb nucleotide window (−500 to +500) surrounding CDS or transcription start sites. ROC/AUC analysis indicated that the optimal promoter window size is −150 to +70 nucleotides (indicated by vertical dashed lines and shading of histogram). Binding events correlated with 1.5-fold induction or repression in the overexpression data set24 are depicted in red and green, respectively. (b) The relationship between the number of binding events detected versus the number of transcriptional changes associated with induction of each TF in this study. Rv0494 (orange triangle) is an example of a TF with prolific binding but limited differential gene expression. Additional genes discussed in text highlighted in yellow with symbols as follows: Rv1657/ArgR (downward triangle), Rv1846v/BlaI (square), Rv3133c/DosR (octagon), and Rv3849/EspR (diamond).

