
Figure 1.
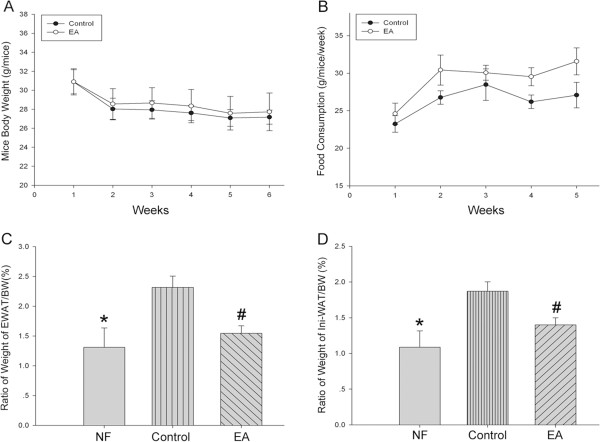
Effects of acupuncture treatment on diet induced obesity mice (DIO). (A) Observation of body weight (EA group), n = 28 in each group. (B) Measurement of food consumptions n = 28 in each group. (C)&(D) Ratio of epididymis white adipose tissue weight or inguinal white adipose tissue weight to mouse body weight. n = 20 for NF group, n = 28 for Control and EA group. Data were expressed as means ± SD, * P < 0.05 vs Control, # P < 0.01 vs Control.