Figure 1.

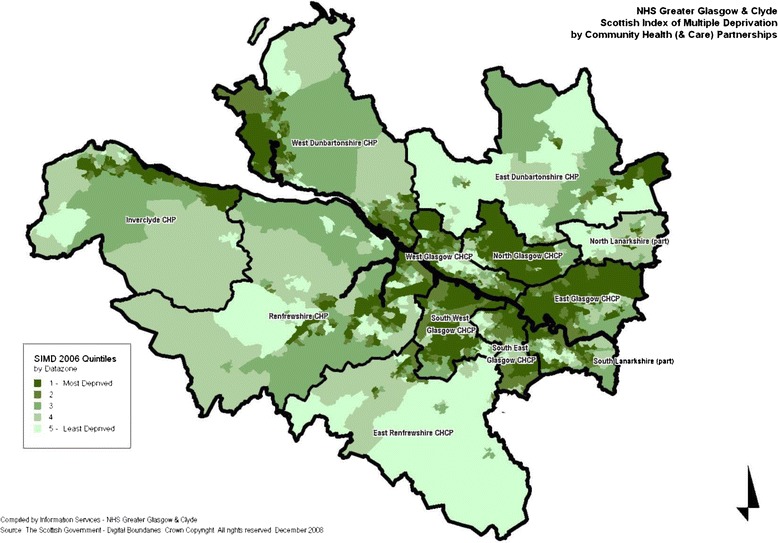
Map of deprivation in greater glasgow and clyde health board. This map reflects the boundaries and levels of area deprivation at the time of birth of the cohort children.

Map of deprivation in greater glasgow and clyde health board. This map reflects the boundaries and levels of area deprivation at the time of birth of the cohort children.