
Figure 4.
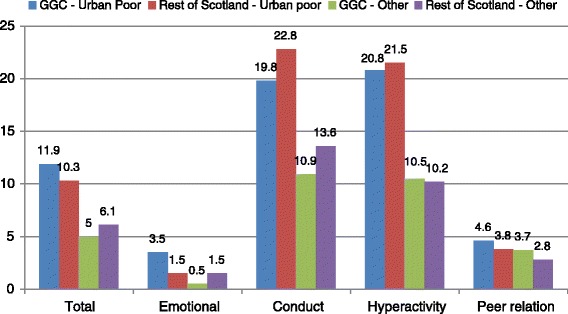
Proportion of children in the abnormal range of each scale by GGC and rest of Scotland by urban-deprivation status.
Official websites use .gov
A
.gov website belongs to an official
government organization in the United States.
Secure .gov websites use HTTPS
A lock (
) or https:// means you've safely
connected to the .gov website. Share sensitive
information only on official, secure websites.
Proportion of children in the abnormal range of each scale by GGC and rest of Scotland by urban-deprivation status.