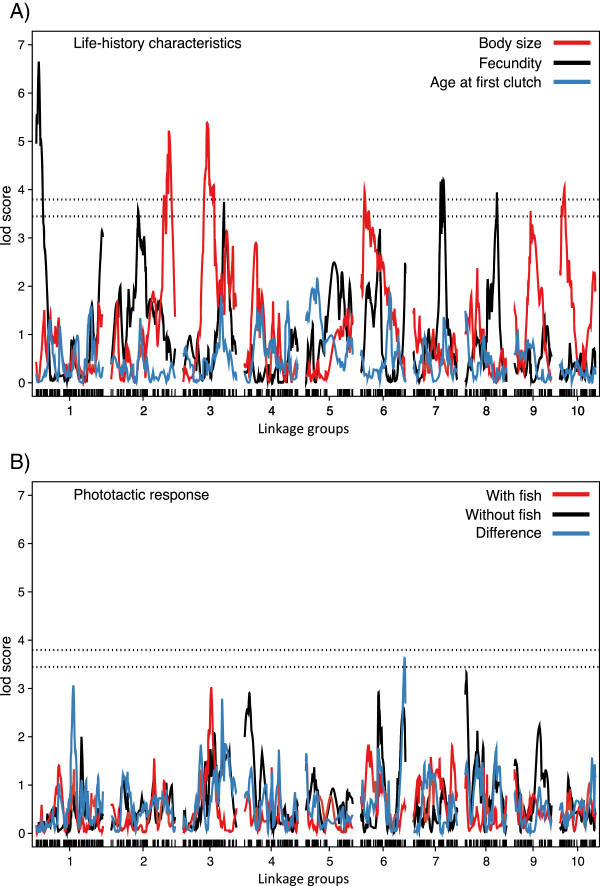
Figure 4.

LOD scores along the 10 linkage groups for variation in A) life history traits and B) phototactic response. Life history traits include body size (red), lifetime offspring production (black), and age at first clutch (blue). Phototactic response characteristics include the phototactic index in the presence of fish (red), in the absence of fish (black) and the difference between the two for each genotype (blue). Dashed horizontal lines indicate genome-wide thresholds used to identify significant (LOD 3.78) and suggestive (LOD 3.44) QTLs.
