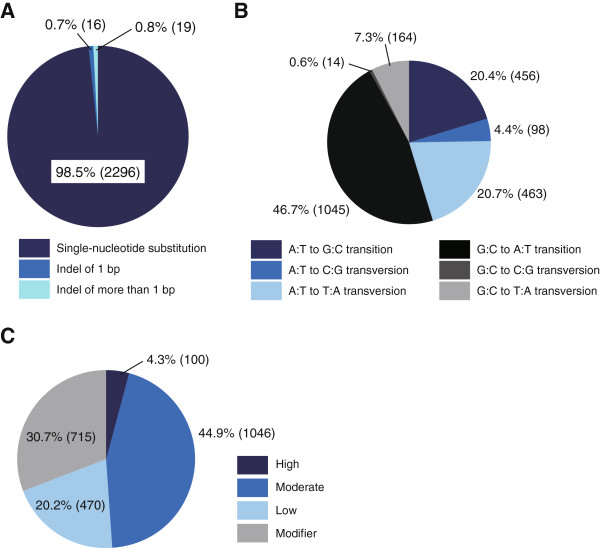
Figure 3.

Characteristics of ENU mutagenesis in haploid ESCs. (A) Mutation types detected by whole-exome analysis. Actual numbers of mutations are shown in parentheses through Figure 3A–C. (B) Frequencies of nucleotide changes. The 2,240 point mutations are classified as transitions or transversions. Fewer than 2.5% of the 2,296 single-nucleotide substitutions could not be classified by our WES analytical pipeline for unknown reasons. We excluded these data from the analysis in Figure 3B. (C) Effects of mutations on genes predicted by SnpEff software (see also Additional file 6: Table S12). If more than one effect was annotated on a single mutation, effects with higher impact prediction were adopted.
