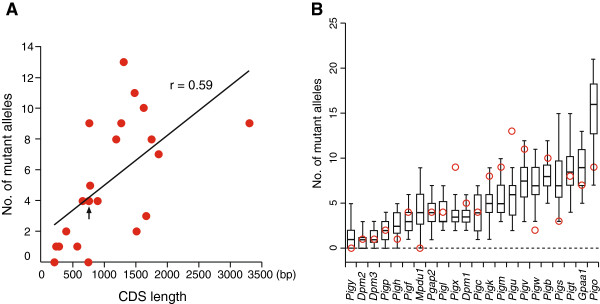
Figure 4.

ENU mutagenesis generates a CDS length-dependent rate of mutants. (A) Scatter plot of 22-gene mutants according to CDS length and the number of independent mutant alleles (Pearson’s correlation r =0.59). An arrow indicates the overlap of the two plots (Pgap2 and Pigl). (B) Box plots representing 20 runs of simulation for the number of mutant alleles. In this simulation, 115 mutagenic hits were generated and assigned to any of the 22 genes. Bars, boxes, and whiskers indicate medians, upper and lower quartiles, and the lowest and highest extremes still within 1.5 times the box sizes, respectively. Columns for the 22 genes are ordered according to CDS length. Experimental data from our functional complementation assay are overplotted (red circles). Notably, 20 of the 22 genes are mutated in at least one ESC clone.
