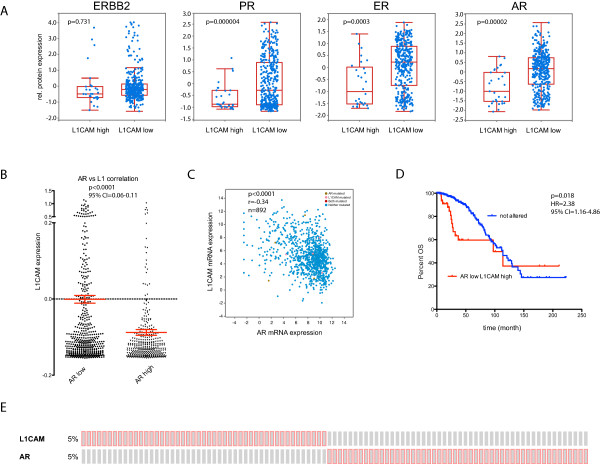
Figure 1.

L1CAM mRNA expression in the TCGA breast cancer collective negatively correlates to AR protein and mRNA expression. Analysis of data from the Breast Invasive Carcinoma (TCGA, Provisional) study using cBioportal. The dataset includes 1002 cases of breast cancer patients. All correlation values were calculated by spearman. (A) Differences in ERBB2, PGR, AR and PGR protein expression of samples that express high amounts of L1CAM mRNA (L1CAM high: Expression > 1.3) to unaltered samples (L1CAM low: Expression < 1.3). (B) L1CAM mRNA expression of specimens that express low (AR low, n = 536) or high (AR high, n = 356) amounts of AR mRNA. P < 0.0001, 95% CI = 0.06-0.11. (C) Scatter plot of L1CAM mRNA expression to AR mRNA expression. Values are given in (RNA Seq V2 RSEM) in log2. n = 892, r = -0.34, P < 0.0001. (D) Kaplan Meier analysis of month survival of cases that express high amounts of L1CAM (Expression > 1.3) together with low amounts of AR (Expression < 1.3) (red line) compared to not altered patients (blue line). P = 0.018, HR = 2.38, 95% CI = 1.16-4.86. (E) Cases set showing overexpression of L1CAM (5%, Expression > 1.3) or AR (5%, Expression > 1.3). Red boxes represent cases with expression > 1.3; gray boxes: unaltered or < 1.3.
