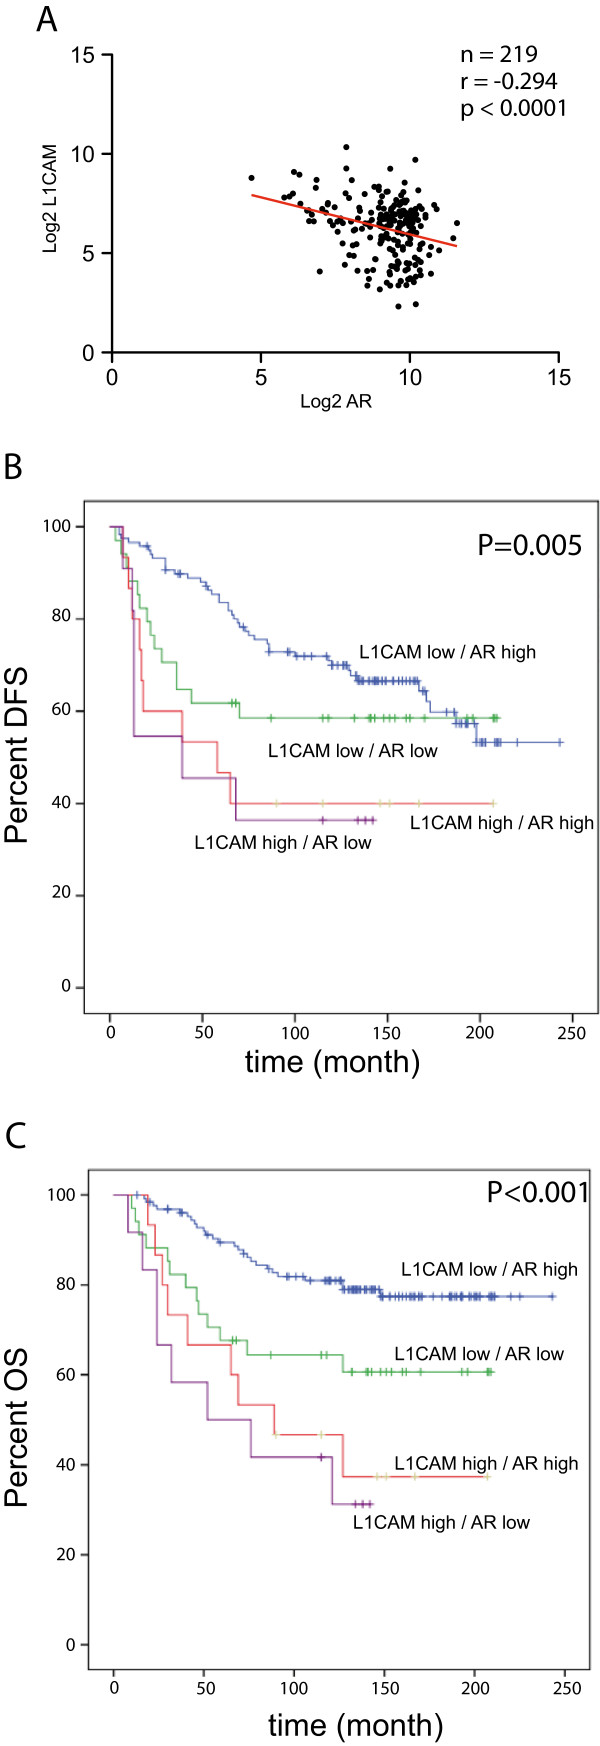
Figure 3.

L1CAM mRNA expression correlates negatively to AR expression in the Hamburg cohort. (A) Scatter plot of L1CAM mRNA expression to AR mRNA expression. Values are given in (RNA Seq V2 RSEM) in log2. n = 219, r = -0.294, P < 0.0001. Kaplan Meier analysis of disease free survival (B) (AR pos, L1CAM neg vs. AR neg L1CAM pos: P = 0.005) and overall survival (C) (AR pos, L1CAM neg vs. AR neg L1CAM pos: P < 0.001) of cases that express different combination of L1CAM and AR. L1CAMlow/ARhigh (blue line), L1CAMlow/ARlow (green line), L1CAMhigh/ARhigh (red line), L1CAMhigh/AR low (violet line).
