Figure 5.

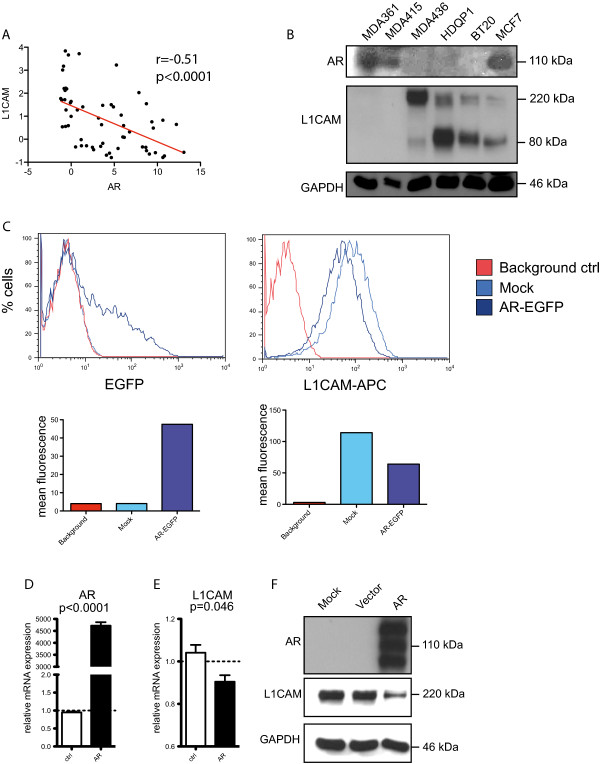
Analysis of breast cancer cell lines for L1CAM and AR expression. (A) The TCGA Cancer Cell Line Encyclopedia (Novartis/Broad, Nature 2012) of breast cancer cell lines was analyzed with the cBio data portal. The dataset includes 59 different breast cancer cell lines. Scatter plot showing L1CAM mRNA expression to AR mRNA expression. Values are given in mRNA Expression z-Scores. r = -0.51, P < 0.0001. (B) Western blot analysis of breast cancer cell lines: MDA361, MDA415, MDA436, HDQP1, BT20 and MCF7. Blot was analyzed with specific antibodies against AR, L1CAM and GAPDH as a loading control. (C) Representative FACS analysis of MDA436 cells that were transfected with an AR-EGFP vector or Mock. Upper row: FACS curves (% cells against log2 intensity) of EGFP and L1CAM (L1CAM-APC) stained with APC. Lower row: calculated mean fluorescence of each curve (n = 4). Transfected cells of (C) were analyzed by qPCR for AR (D) and L1CAM (E) expression. (F) Western blot analysis of MDA436 cells that were transfected with AR-EGFP, an empty vector or mock. Blots were analyzed with specific antibodies against AR, L1CAM and GAPDH as loading control (n = 3).
