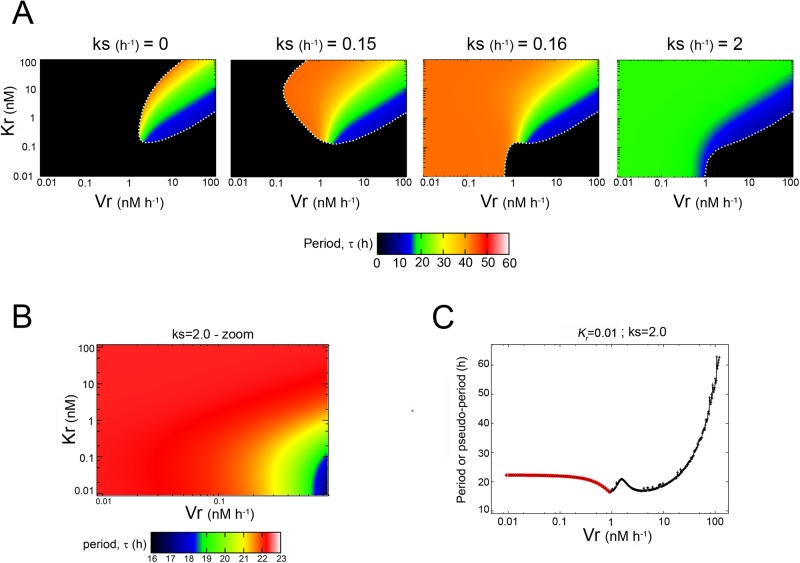
Figure 3. Dependence of the period (τ) with ks, Vr and Kr, for nH = 4.
(A) The τvalues are shown in pseudocolor within the Kr-Vr-parameter space for different values of the ks parameter from 0 (left) to 2 h −1 (right). Black areas indicate zones in which there are damped oscillations. A white dotted line was added in order to emphasize the transition between the two dynamical behaviors observed in our model. Note the changes in the oscillatory domain and the τ length with ks (the color key for τ is at the bottom of the plots). (B) An inset of the Kr-Vr-space shown in panel A for ks = 2 h −1 (right) shows the subtle changes in τ. Note that the key color was rescaled in order to display the differences in more detail. (C) Dependence of τ (red line) with Vr for a fixed value of Kr = 0.01 nM). Black line shows the pseudo-period value for damped oscillations. See the text for further details.

