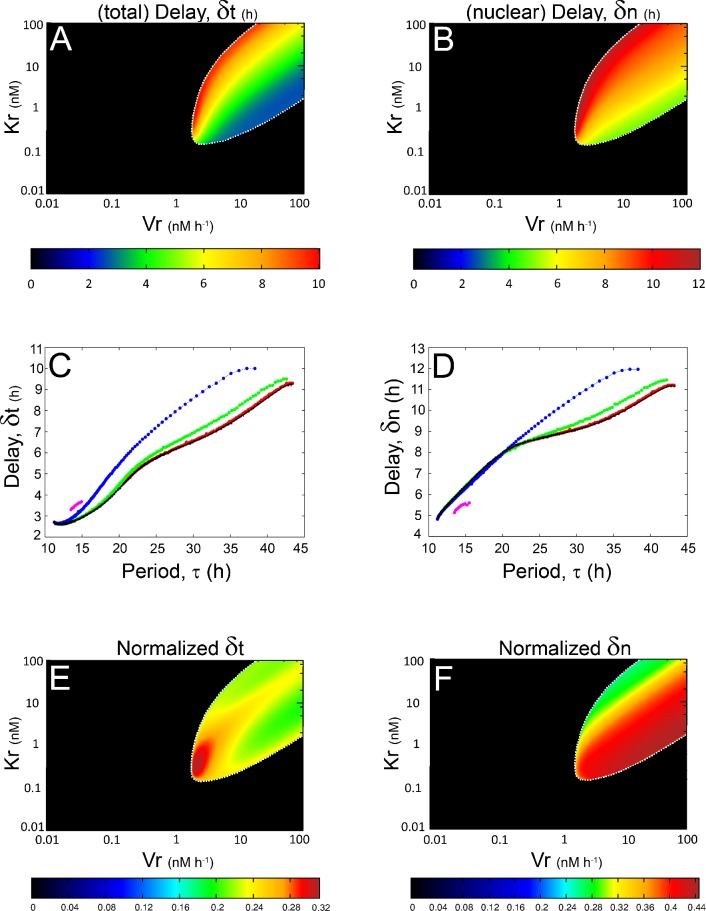
Figure 5. Analysis of the delays when PER translation is achieved by a single kinetic mechanism.
Total delay (A) and nuclear delay (B) diagrams within the Vr-Kr parameter subspace, for a cooperative model in which ks = 0 h −1. Total delay profile (C) and nuclear delay profile (D) diagrams as functions of the period τ. Each color line represents a fixed value of Kr, as follows: red = 100 nM; green = 10 nM; blue = 1 nM and magenta = 0.14 nM. For a better comparison we have included the profile δt versus τ for the model with a translational process achieved only by the R-independent mechanism (Vr = Kr = 0), which follows a first-order kinetics (black line). All these curves increase monotonically as τ increases. Figs. 5 E and F represent, respectively, the normalized total delay and nuclear delay diagrams within the Kr-Vr-subspace. The color key for each Kr-Vr-diagram is shown at the bottom of each plot. In those diagrams a white dotted line was added in order to emphasize the transition between the two dynamical behaviors observed in our model.

