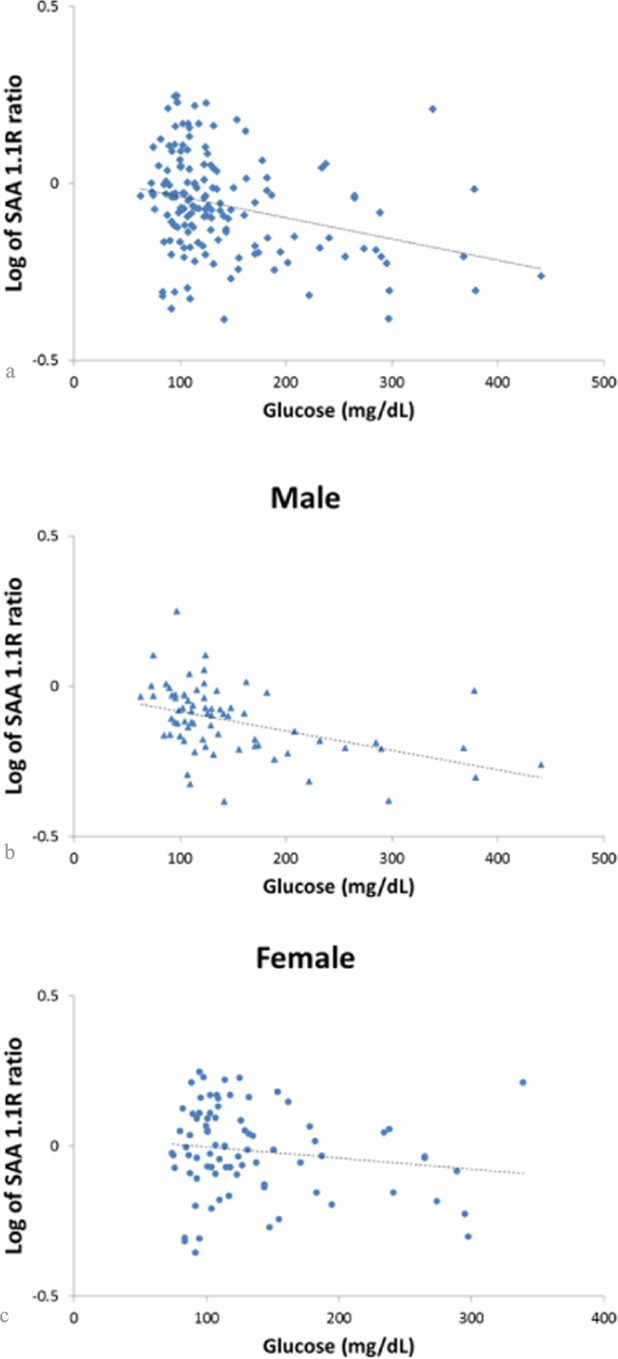
Figure 3. Correlation between glucose and the log of SAA 1.1R ratio in the entire group (panel a), in males (panel b), and in females (panel c).

In the entire group, the log of SAA 1.1R was inversely related to glucose levels (panel a, r = −0.3, p<0.001). This correlation was driven by the males in the study. The log of SAA 1.1R was inversely correlated to glucose in males (panel b, r= −0.44, p<0.001), but not in females (panel c, r = −0.15, p = 0.17).
