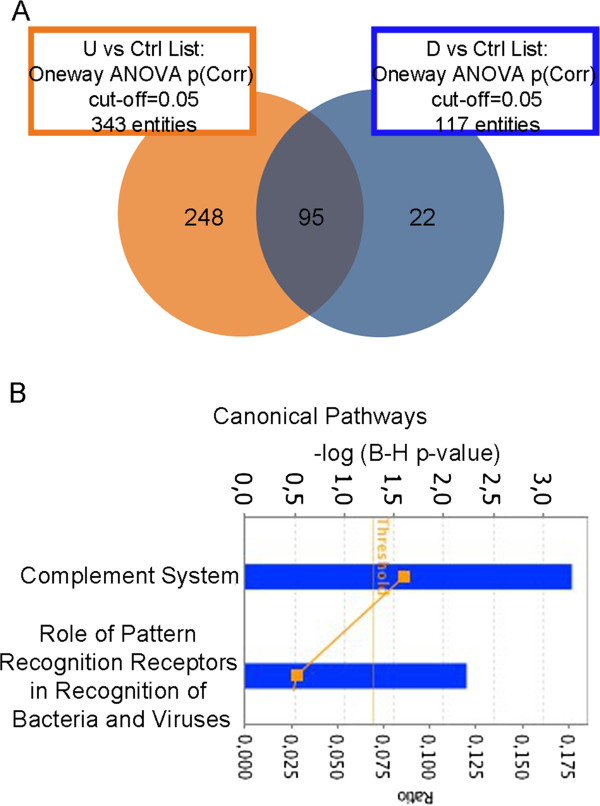
Figure 6.

Transcriptomics analyses in livers of 12 months P exposed mice. (A) Venn Diagram showing probe set overlap between U (orange) and D (blue) compared to the control group after 12 months of treatment started at PND 21. (B) Canonical pathways deregulated in liver of exposed P mice. See Figure 5 caption for graphic description.
