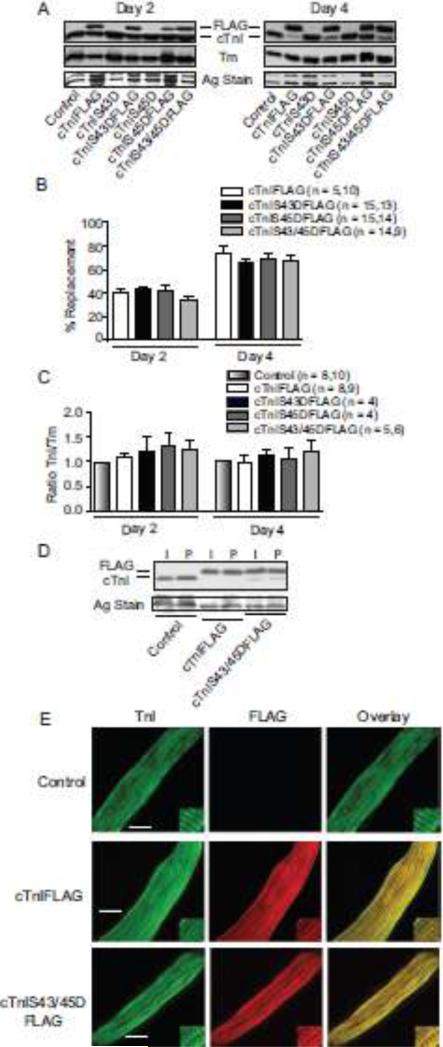
FIGURE 1. Protein expression, thin filament stoichiometry, and sarcomere incorporation of cTnI phosphomimetics 2 and 4 days after gene transfer.
A. Representative immunoblots show protein expression of cTnI and cTnI phosphomimetics (cTnIS43D, cTnIS45D, cTnIS43/45D) with and without FLAG tags. The FLAG- and non-tagged cTnI (upper panel), Tm expression (middle panel), and a silver (Ag)-stained gel band (lower panel) are shown to indicate protein loading in each lane. B. Quantitative analysis of the percent replacement with individual FLAG-tagged constructs 2 (left) and 4 (right) days after gene transfer. The number of individual hearts analyzed is indicated by the n value in this panel and panel C. Results in both panels were compared with a 1-way ANOVA (p>0.05) for statistical comparisons. C. Quantitative analysis of thin filament stoichiometry based on the cTnI/Tm expression ratio in myocytes expressing FLAG-tagged cTnI substitutions. Ratios were normalized to time-matched controls for each phosphomimetic cTnI (see Methods) at 2 (left) and 4 (right) days post-gene transfer. Comparable results were obtained for non-tagged constructs (not shown). D. Representative Western blot showing comparable replacement of endogenous cTnI with each construct in intact (I) and permeabilized (P) myocytes. E. Representative confocal projection images for control, cTnIFLAG- and cTnIS43/45DFLAG-expressing cardiac myocytes immunostained for TnI and FITC (left; bar = 10 μm), FLAG and Texas Red (middle), plus the overlay (right). Myocytes expressing cTnIS43DFLAG and cTnIS45DFLAG produced comparable IHC patterns (not shown).

