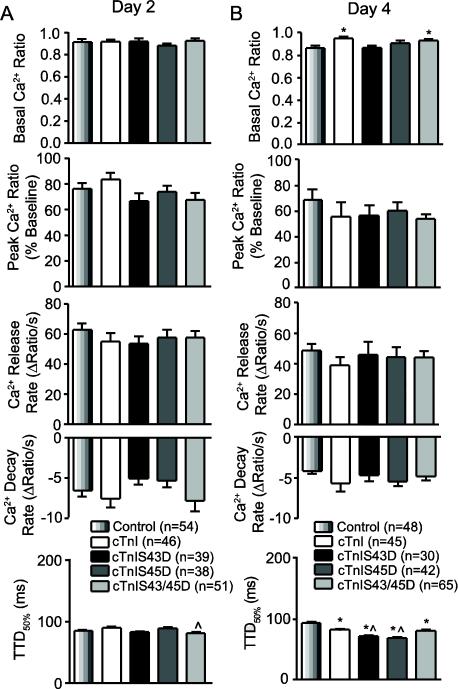
FIGURE 3. Quantitative analysis of Ca2+ handling in electrically paced, Fura-2AM-loaded adult myocytes 2 (A) and 4 (B) days after gene transfer.
The basal Ca2+ ratio, peak Ca2+ transient amplitude (% baseline), rates of Ca2+ release and re-uptake, and time to 50% decay (TTD50%) were evaluated for each Ca2+ transient. Statistical differences between cTnI phosphomimetics and controls (*p<0.05; ANOVA) and/or cTnI-expressing myocytes (^p<0.05) are indicated in each panel. Sample n is shown in each legend.

