
Figure 4. Mitochondria from FATP1 hearts exhibit decreased complex II oxygen consumption rate, unchanged ATP synthesis rate, and decreased SDHB transcript and protein and decreased complex II activity.
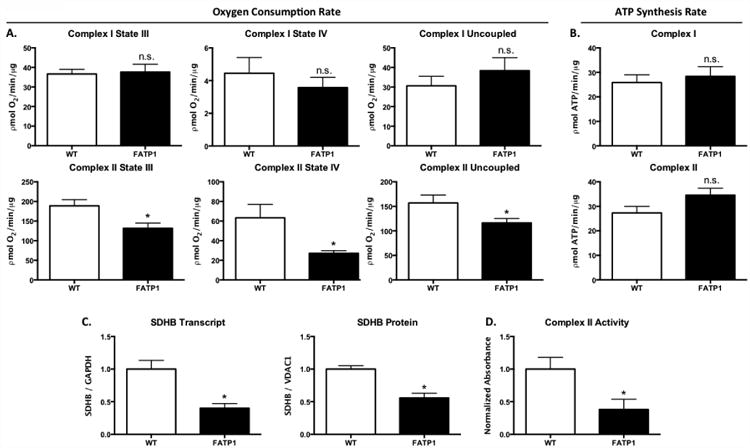
Oxygen consumption rate (OCR) in picomoles of oxygen per minute per microgram of isolated mitochondria and ATP synthesis rate as picomoles of ATP per minute per microgram of isolated mitochondria. A. Complex I substrate = 5mM pyruvate and 5mM malate. B. Complex II substrate = 5mM succinate and 2μM rotenone. C. Transcript level and protein expression of succinate dehydrogenase subunit B (SDHB) normalized to GAPDH and VDAC1, respectively. D. Complex II activity measured as mOD per minute per microgram of protein. (n = 6-8 for OCR and n = 4 for ATP synthesis. n = 5 for qRT-PCR and IB, n = 3-4 for complex activity. * = p<0.05 vs wild-type. N.S. = not significant. Error bars are mean ± standard error).