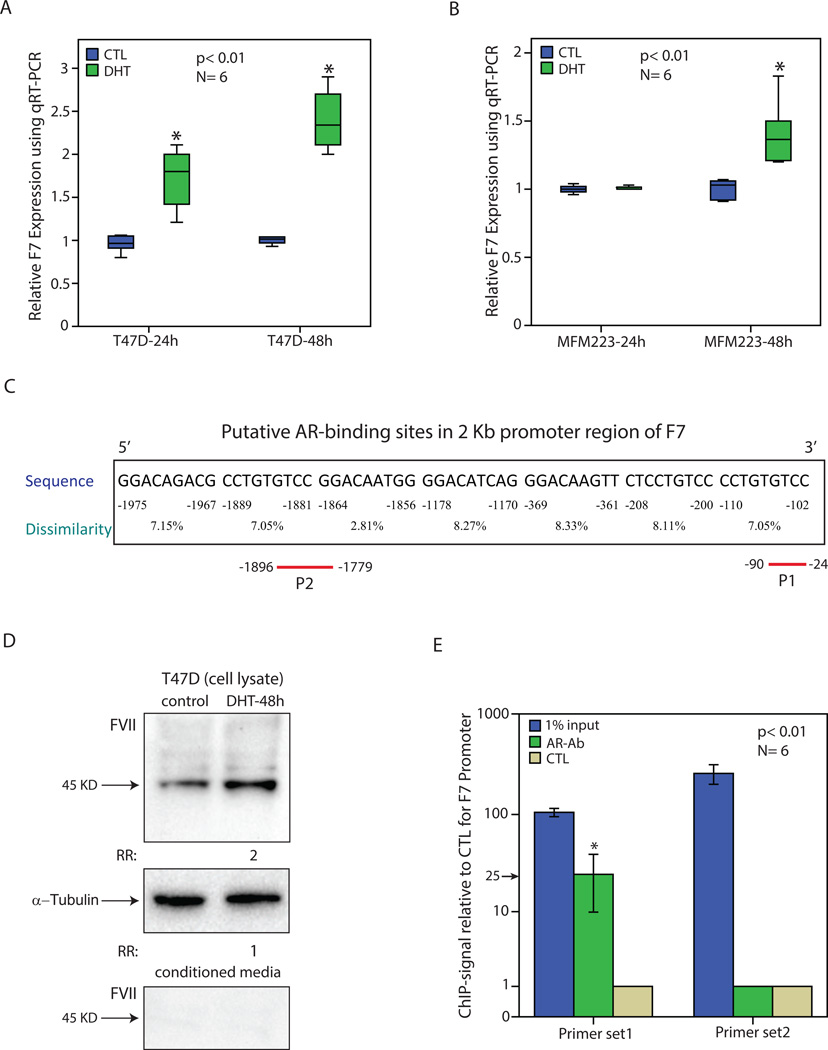
Figure 4.
Regulation of factor VII transcript and protein levels by AR in breast cancer. (A) Relative expression of F7 using qRT-PCR in T-47D cell line following treatment with DHT for 24 and 48 hours. Expression values are presented relative to the control (CTL) experiments at each time-point. Experiments were carried out in 6 replicates and *, p< 0.01 is for DHT-treated vs. control groups. (B) Relative expression of F7 in MFM-223 cell line following treatment with DHT as outlined in (A). (C) Putative AR-binding sites in the 2 Kb promoter region of F7 gene using PROMO software. Binding sites were predicted within a dissimilarity margin ≤ 15%. Location with respect to the ATG start codon, sequence, and dissimilarity margin is depicted for each putative binding site. P1 and P2 represent the amplicons used for ChIP assays. (D) Western blot analysis to show FVII level following DHT treatment for 48h in T-47D cell line using cell lysates or conditioned media. Fold change (RR) in band density was measured relative to the control in three replicate experiments. Rabbit α-tubulin antibody was applied to assess loading for cell lysates. (E) Chromatin immunoprecipitation (ChIP) with two primer sets for F7 promoter and AR antibody (AR-Ab). Amplification of 1% of input chromatin was used as the input control and non-specific antibody (CTL) served as a negative control. Each assay was carried out in six replicates and ChIP-signal was calculated as fold enrichment of F7-amplicon relative to the negative control. *, p< 0.01 is for AR-Ab vs. CTL. Error Bars: ± 2SEM.

