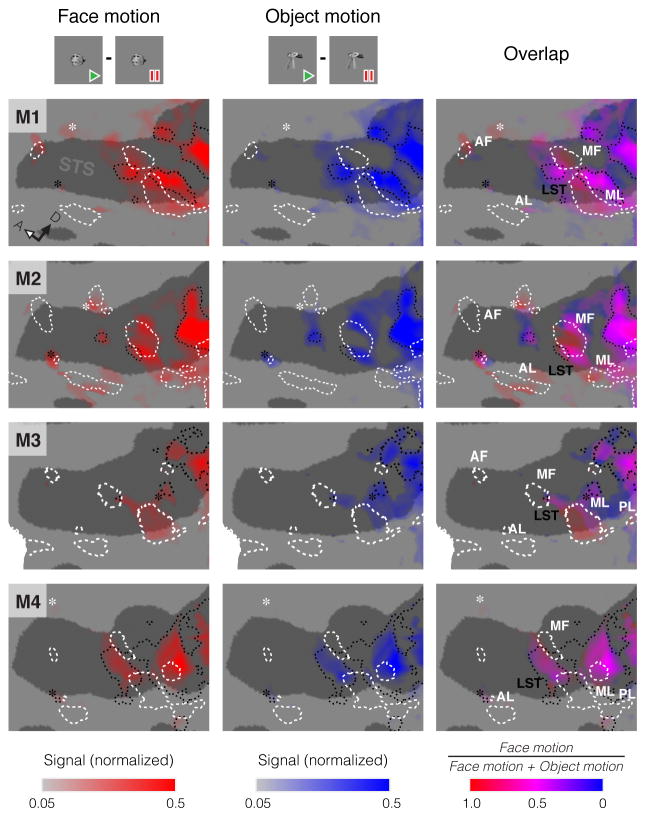
Figure 1. Selectivities for Motion Carried by Faces or Non-Face Objects along the Macaque STS.
Regions responding to face motion (left column, red; natural face movies - face pictures) or non-face object motion (middle column, blue; natural object movies - object pictures), and the relative strength of these contrasts (right column), in the left hemisphere of each subject. Opacity reflects the contrast strength (normalized signal change). This data is presented on a flattened cortical model of the area surrounding the STS, with dark gray regions representing sulci and light gray regions representing gyri (as in Figure S2B). Dashed white lines outline areas of static face selectivity and dotted black lines outline areas of low-level motion selectivity, both measured in independent experiments (Figure S2). Similarly, white labels indicate face patches and black labels indicate motion areas. Black asterisks highlight areas responding to face and object motion outside of recognized motion processing areas. White asterisks highlight areas more activated by face motion than object motion outside of known face patches. For orientation, the white-filled arrow points anteriorly and the black arrow points dorsally.
Signal change in maps is normalized per-subject and thresholded at a false discovery rate (FDR) of q < 0.01. See also Figure S2.

