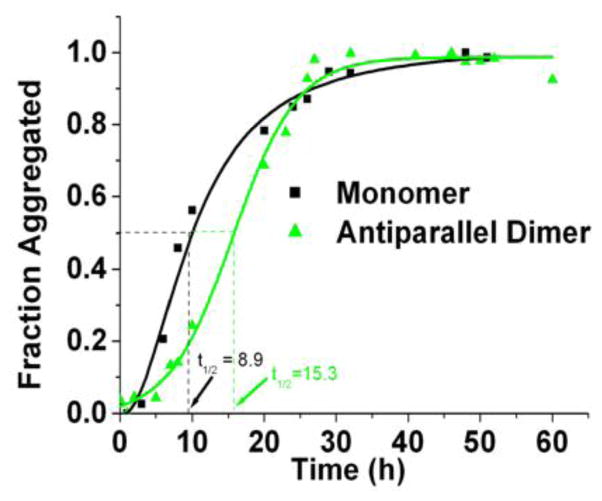
Figure 2.
Normalized time-dependent thioflavin (ThT) fluorescence plots. The aggregation kinetics of the monomer (black square), pH 5.6 and AP-hairpin (green). Aggregation half-times are indicated by the dashed lines that are color-coded to match their respective peptide, as they intercept with the x-axis.

