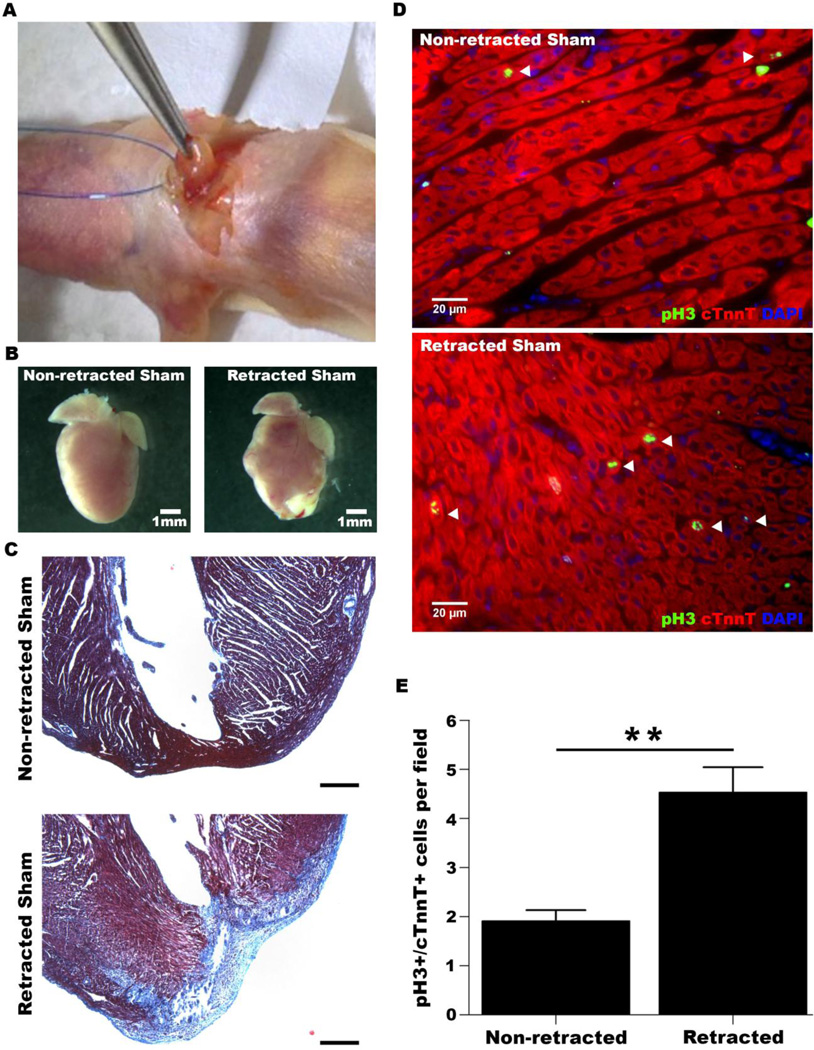
Figure 2. Surgical retraction results in fibrosis and an increase in cardiomyocyte cell cycle activity.
Hearts were isolated and stained at 7 dpr. A. Image depicting the surgical retraction procedure. B. Representative images of non-retracted and retracted sham hearts. C. Trichrome staining of sections from non-retracted and retracted sham hearts. Apical regions of the left ventricle are shown. Scale bar: 100 µm. D. Representative stainings of sections at 7 dpr for phospho-H3 and cardiac troponin t. Arrowheads indicate pH3+/cTnnT+ cells. E. Quantification of pH3+/cTnnT+ cardiomyocytes. (Non-retracted Sham: n=6, Retracted Sham: n=10). **p<0.01.

