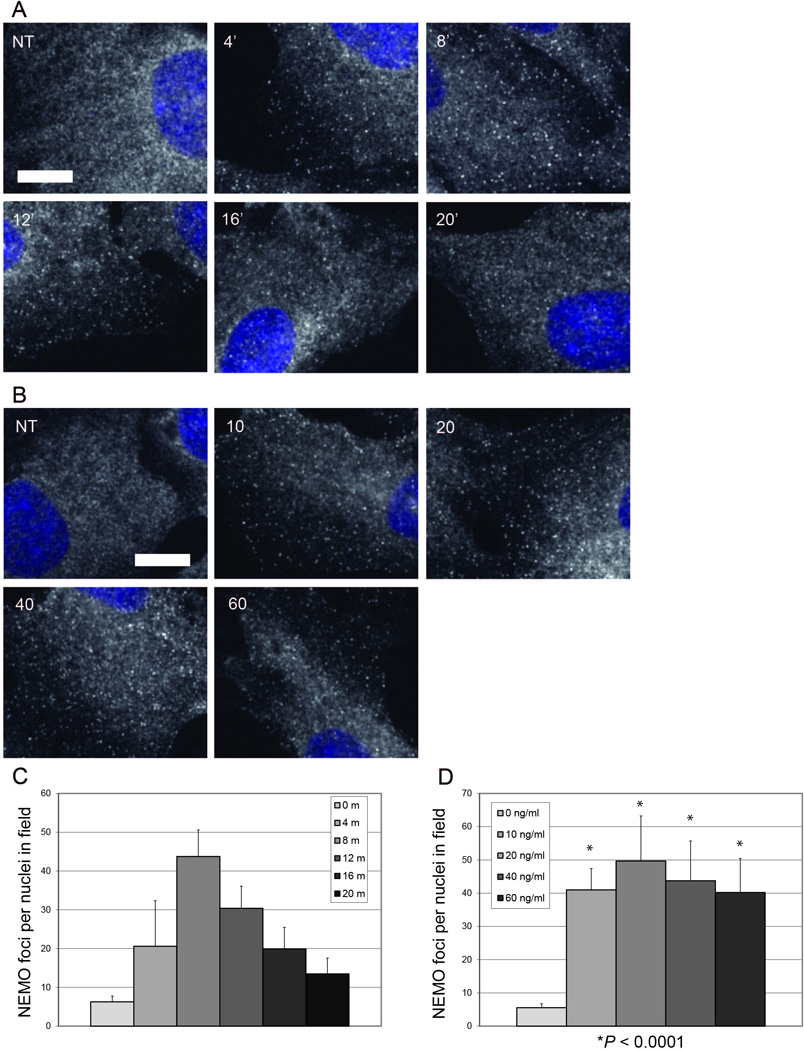
Figure 5. In situ detection and quantification of TNF-induced NEMO structures.

(A) NEMO immunofluorescence in WT RPE cells. Cells were either untreated (NT) or treated with 10 ng/ml TNF for 4, 8, 12, 16 or 20 minutes before fixation. Each image is a merge of NEMO immunofluorescence and Hoechst nuclear stain. Size bar represents 10 µm.
(B) NEMO immunofluorescence in WT RPE cells. Cells were either untreated (NT) or treated with 10, 20, 40, or 60 ng/ml TNF for 8 minutes before fixation. Each image is a merge of NEMO immunofluorescence and Hoechst nuclear stain. Size bar represents 10 µm.
(C) The number of NEMO foci per nuclei in the same field were plotted for the TNF time course in (A) (mean + SD). N = 10 random 600× images for all time points.
(D) The number of NEMO foci per nuclei in the same field were plotted for the TNF dose course in (B) (mean + SD). N = 10 random 600× images for untreated and all TNF doses. * = P < 0.01 versus untreated.
