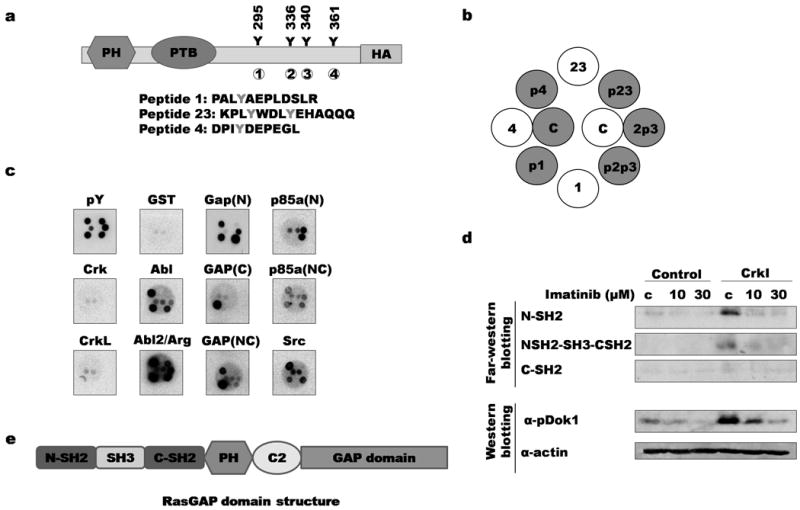
Figure 3. Binding of SH2 domains to Dok1 phosphorylation sites.

a) Phosphorylation sites on Dok1 are indicated; each site is numbered from 1 to 4. Sequences of corresponding synthetic peptides are indicated below. b) Synthetic peptides were spotted to filters in the pattern shown. Grey circles and “p” indicate tyrosine phosphorylation of corresponding site (for example, “p1” denotes peptide in which site 1 is phosphorylated); c: control (whole cell lysates) c) Peptide-spotted filters were probed with purified SH2 and PTB domains. Binding results for selected domains are shown (for data for all domains, see Supplementary Figure 1). GAP(N): RasGAP N-terminal SH2 domain; GAP(C): RasGAP C-terminal SH2 domain; GAP(NC): Both SH2 domains and SH3 domain of RasGAP; p85a(N): PI3K regulatory subunit 1 (α) N-terminal SH2 domain; p85a(NC): PI3Kα N- and C-terminal SH2 domains; GST: negative control; pY: anti-pTyr antibody. d) Far-Western and immunoblotting of lysates from imatinib-treated control and CrkI-transformed NIH3T3 cells. Top, lysates were probed with GST-RasGAP SH2 domain fusions; bottom, same lysates were probed with phosphospecific Dok1 antibody. C: untreated control lysates. e) RasGAP domain structure. C2: C2 domain.
