Figure 1.

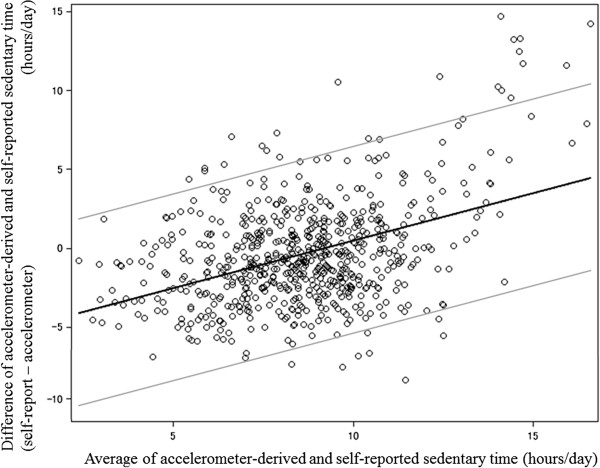
Bland-Altman plot for accelerometer-derived and self-reported sedentary time. Solid black line indicates regression line for difference and average of two measures. Gray lines indicate the 95% limits of agreement.

Bland-Altman plot for accelerometer-derived and self-reported sedentary time. Solid black line indicates regression line for difference and average of two measures. Gray lines indicate the 95% limits of agreement.