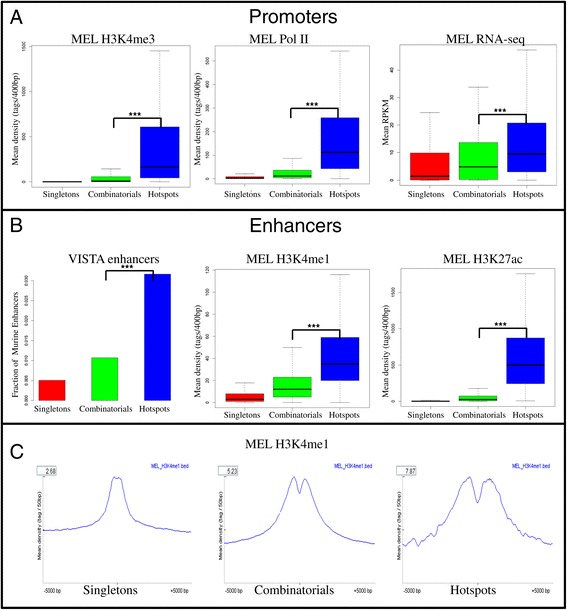
Figure 4.

Hotspots lie near highly expressed genes and are enriched for enhancers in nucleosome flanked regions. A. Boxplots for the peak height for H3K4me3, RNA polymerase II using ChIP sequencing as well as average RPKM value using RNA sequencing data in MEL cells for the three groups (singletons – red, combinatorials - green, hotspots - blue) showing higher peak height for all chromatin modifications in hotspots. B. Bar graph of fraction of VISTA enhancers [19] and Boxplots for the peak height for H3K4me1, H3K27ac using ChIP sequencing in the three groups in MEL cells concluding hotspots were enriched for enhancers. C. The average density plot of MEL H3K4me1 in the 10 kb window for each of the three groups showing hotspots had a bi-modal H3K4me1 peak while singletons have a mono-modal peak.
