
Figure 2.
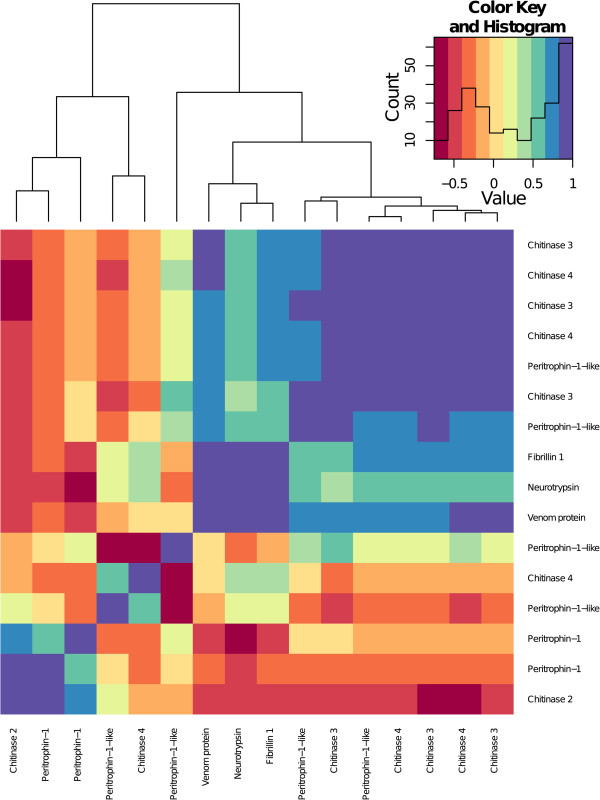
Correlations of the chitin transcripts’ expression patterns that where differentially expressed twenty four hours post-infection compared to uninfected samples (infected versus uninfected). Clustering is produced based on Euclidean distances. The histogram shows the distribution of correlation values.