
Figure 3.
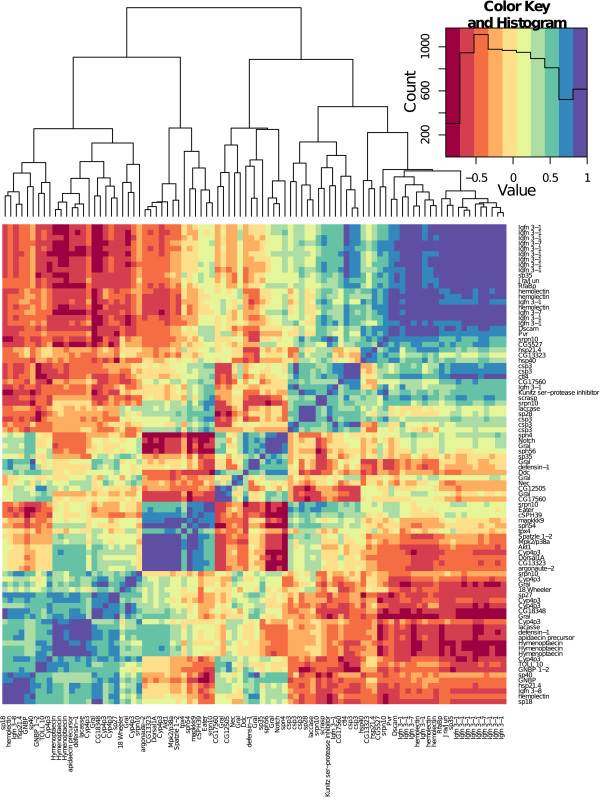
Correlations of the immunity transcripts’ expression patterns that were differentially expressed depending on host genotype – parasite genotype interactions (Specifcity). Clustering is produced based on Euclidean distances. The histogram shows the distribution of correlation values.