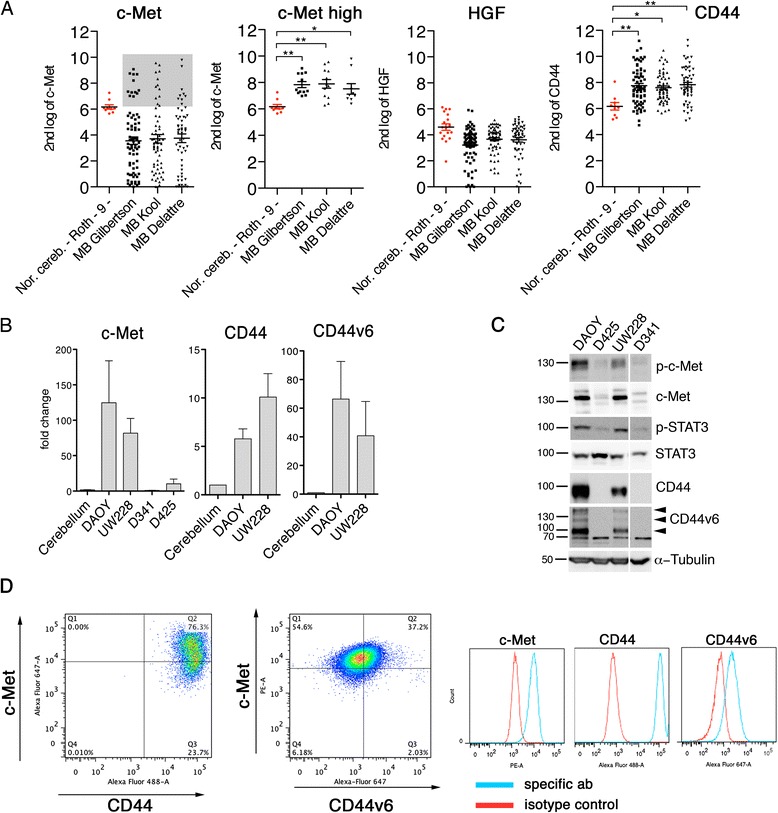
Figure 1.

Expression of c-Met in medulloblastoma clinical samples and cell lines. (A) Expression analysis of c-Met, HGF and CD44 in three different MB tumor collections (ntotal = 195) and in normal adult cerebellum (n = 9). (B) Comparative quantitative real-time PCR expression analysis of c-Met, CD44 and CD44v6 in established MB cell lines and adult cerebellum sample. (C) Expression and activation analysis of the c-Met pathway, CD44, and CD44v6 by immunoblotting (IB) in four different MB cell lines using the antibodies indicated to the right of the blots. (D) Flow cytometry analysis of DAOY cells quantifying surface expression of c-Met, CD44, and CD44v6. Dot plots compare expressions of c-Met and CD44 or c-Met and CD44v6. Histograms show relative fluorescence intensities of isotype control and specific antibody samples.
