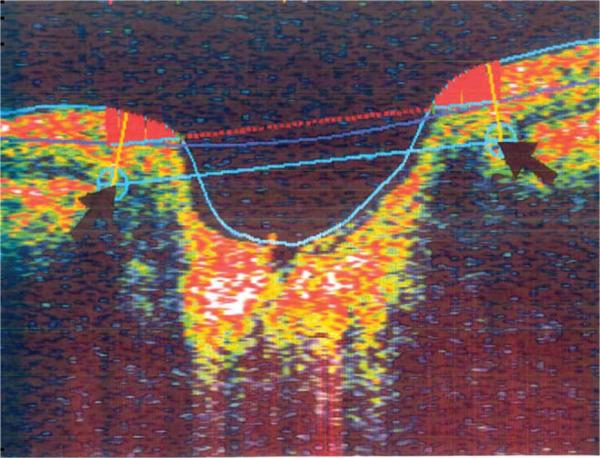
FIGURE 1.
Optic nerve head analysis conducted by Stratus OCT. Reference points and black arrows correspond to the outer and inner RPE edges. The solid straight blue line between the two disc reference points represents the disc diameter. Cup diameter is measured along the dashed red line, offset 150 μm anteriorly from the reference line. The straight yellow line connecting each disc reference point with the nearest point on the anterior surface represents the average of the nerve bundle widths at the disc margin bilaterally. Rim area is demarcated by the cup line posteriorly (dashed red line) and average nerve width at the disc margin (solid yellow lines).

