
Fig. 6.
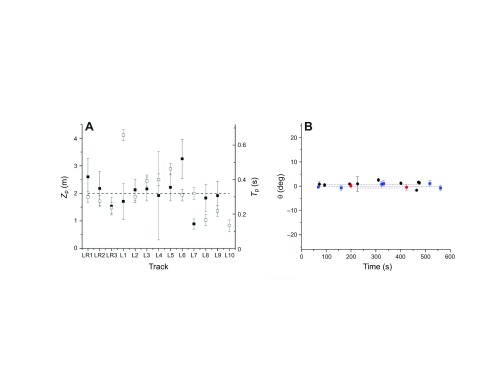
Impact posture and headcam stability data. (A) Distance from target (Zp, solid squares) and time (Tp, open squares) at which the goshawk began to assume impact posture. Dashed line: mean value of Zp and Tp. (B) Average horizontal fixation angle θ of stationary objects for three videos (different color symbols) versus time, plotted over the measured range. Dashed lines: average values for each time series.