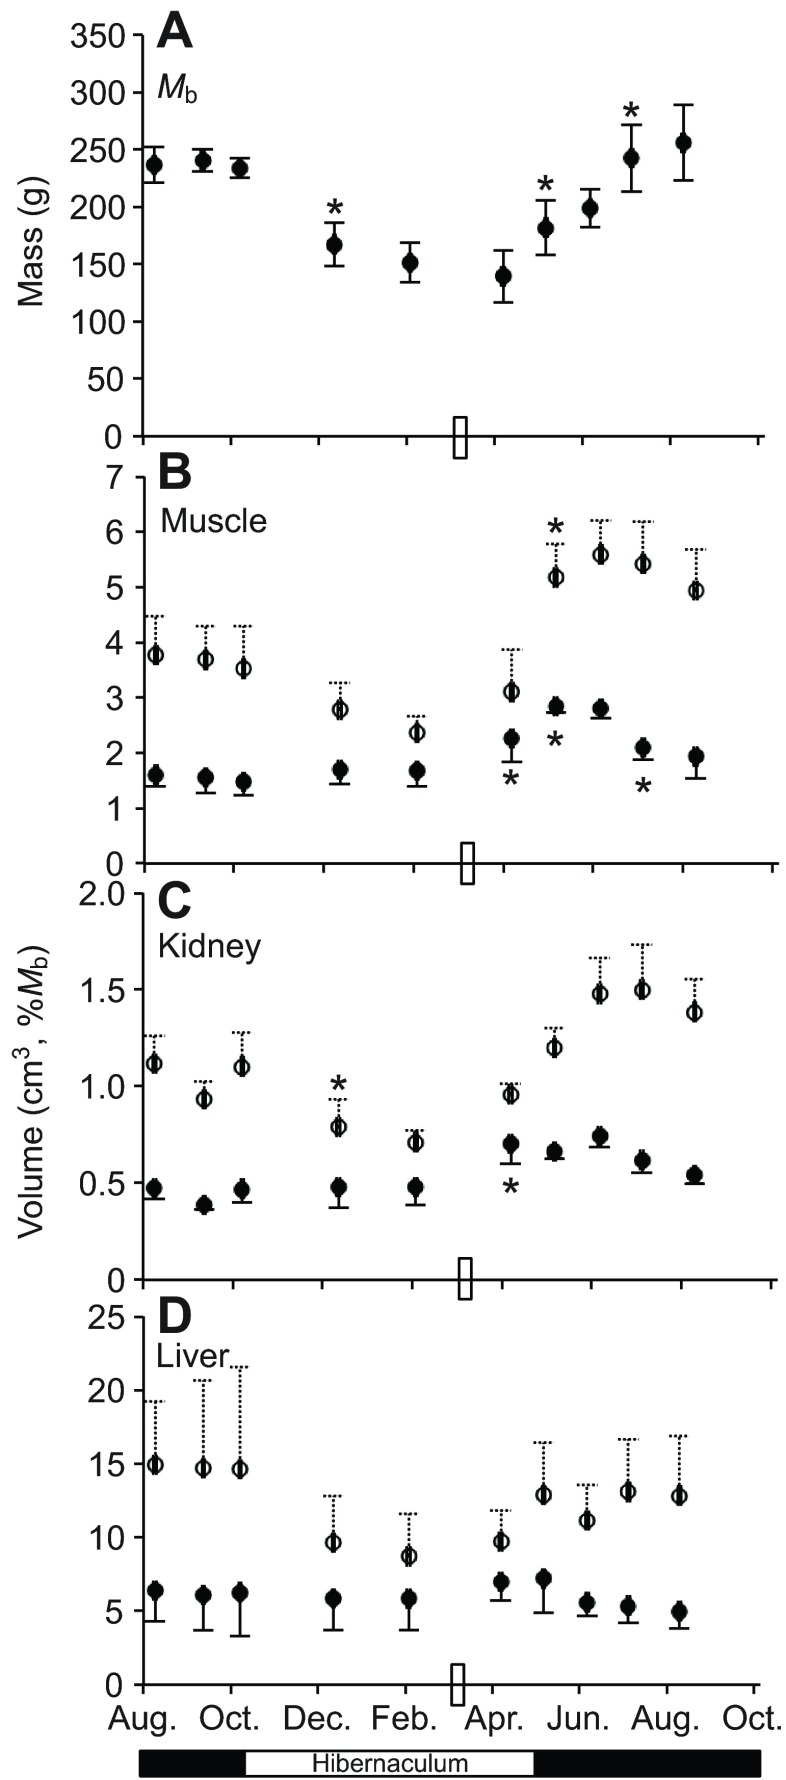
Fig. 1.
Sequential animal mass and tissue volumes across a single year in thirteen-lined ground squirrels. (A) Body mass (Mb, mean ± s.d.) of the same six individuals collected at 10 time points across a single year, with N=1 individual dropped from the study after 9 April (time point no. 6). (B–D) Tissue volume (mean ± s.d.) monitored by MRI is presented in cm3 (open symbols) and normalized to individual Mb (filled symbols) of hindlimb muscle (B), kidney (C) and liver (D). Asterisks indicate a significant difference (Tukey's test, P<0.05) between the identified sample and the preceding time point. The rectangle on the x-axis represents the time point at which food and water were returned to the cages; hibernaculum versus standard rodent housing is indicated below the x-axis.

