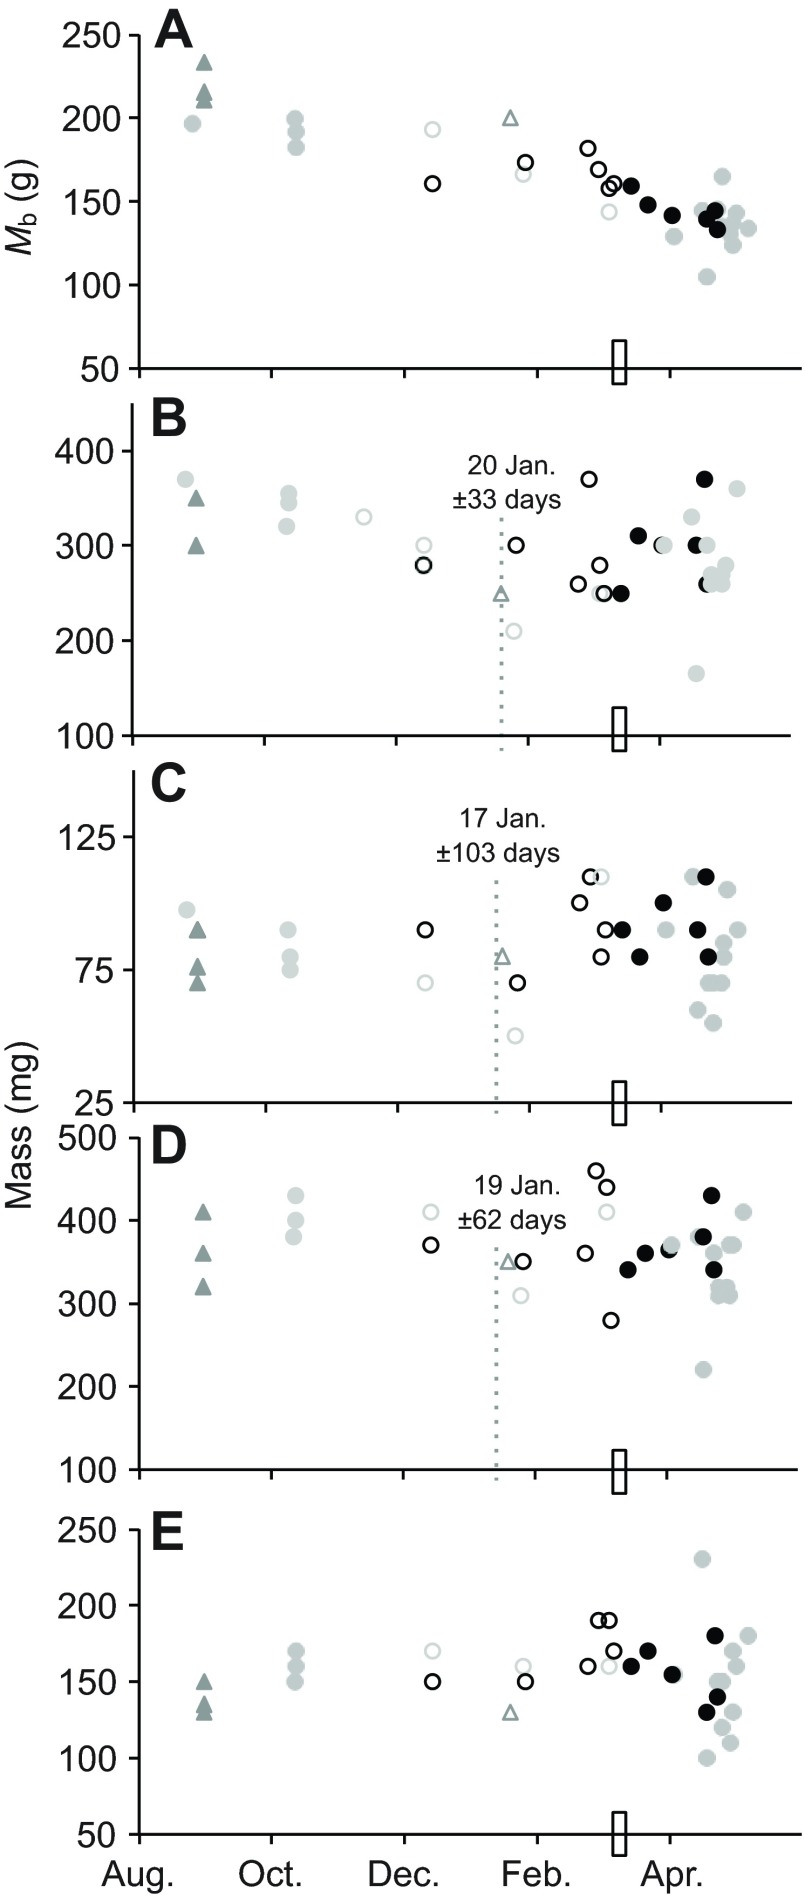
Fig. 2.
Skeletal muscle mass in thirteen-lined ground squirrels. Mb at time of tissue collection in non-weight-matched animals (A) is plotted alongside wet mass of four muscles: rectus femoris (B); biceps brachii (C); gastrocnemius (D); and soleus (E). Animals were sampled pre-hibernation (N=6) and across the hibernation season (N=27). Open circles represent individuals that did not have access to food or water; closed symbols indicate individuals to whom food was available although consumption, if any, was not documented (the rectangle on the x-axis indicates the time point at which food and water were returned to the cages in the hibernaculum). Segmented regression analyses for all animals (day of year ± s.e.m., dotted lines) are included when they indicated that a single regression (slope and intercept) could not explain the time course data. Breakpoints were calculated after normalizing muscle mass to 1 October Mb, to control for the lack of weight-matched sampling groups. Animal gender is designated as female (grey symbols), male (black symbols) or unknown (triangles).

