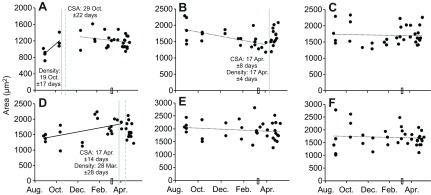
Fig. 3.

Myocyte cross-sectional area across hibernation in thirteen-lined ground squirrels. Rather than decline in winter atrophy, average myocyte cross-sectional area appears seasonally increased or stable. Cross-sectional area across the sampling period is presented for diaphragm (A), rectus femoris (B), soleus (C), biceps brachii (D), semitendinosus (E) and gastrocnemius (F). A segmented regression analysis indicated that a single regression (slope or intercept) could not explain the time course data for diaphragm, biceps brachii or rectus femoris (panels A–C), therefore the regression breakpoint estimates (±s.e.m.) derived from the analyses are indicated by grey dotted lines. Continuous vertical lines indicate the corresponding breakpoints in cell density for the same data set, indicating that myocyte size and density display co-ordinate patterns in hibernation. A rectangle on the x-axis represents the time point at which food and water were returned to the cages. Continuous lines denote significant linear relationships; broken lines reflect non-significance.
