
Table 1.
Comparison of the demographic and clinical data according to stroke severity
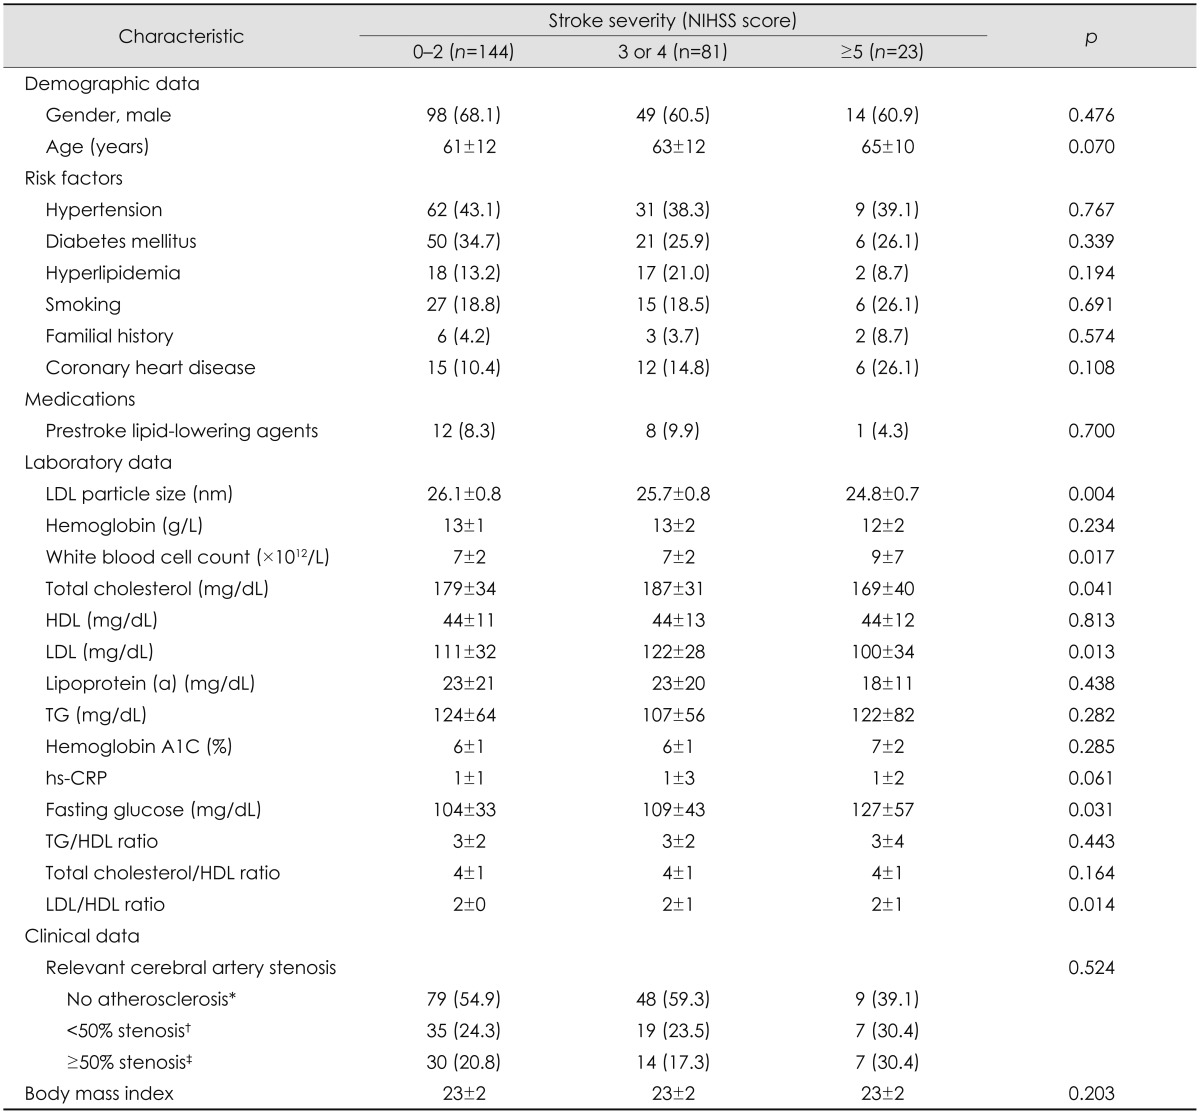
The data are presented as n (%) or mean±SD values.
*No stenosis, †One or more vessels with <50% stenosis, ‡One or more vessels with 50% stenosis.
HDL: high-density lipoprotein, hs-CRP: high-sensitivity C-reactive protein, LDL: low-density lipoprotein, NIHSS: National Institutes of Health Stroke Scale, TG: triglycerides.