
Table 2.
Comparison of clinical variables between patients with a good and poor functional outcomes at 3 months
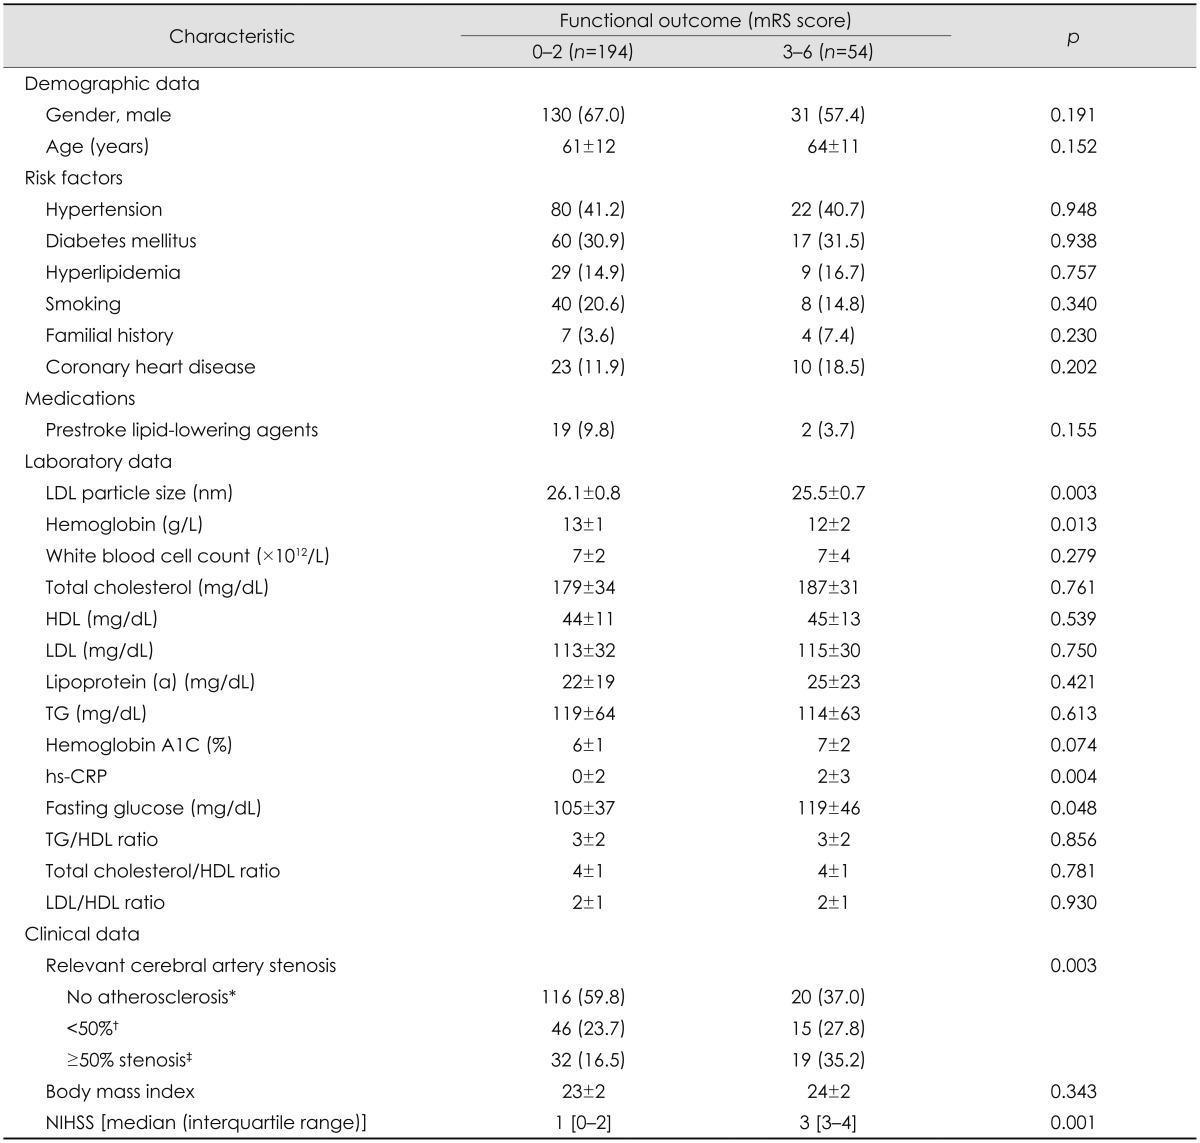
The data are presented as n (%), mean±SD values or median (interquatile ranges).
*No stenosis, †One or more vessels with <50% stenosis, ‡One or more vessels with 50% stenosis.
HDL: high-density lipoprotein, hs-CRP: high-sensitivity C-reactive protein, LDL: low-density lipoprotein, mRS: modified Rankin Scale, TG: triglycerides.