
Figure 2.
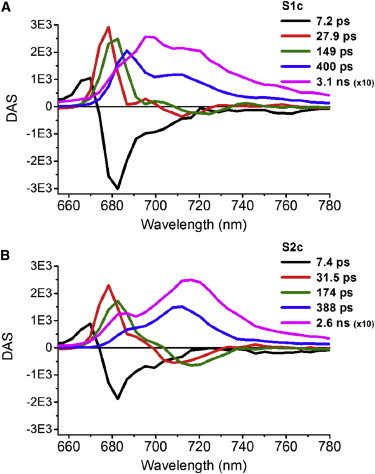
DAS estimated from GA of 77 K time-resolved fluorescence emission spectra of intact instantly frozen WT C.r. cells chemically locked in state 1 (S1c) or in state 2 (S2c). The decay and rise in the 30-ps (red) and 160-ps (green) DAS reflects EET from LHCII to PSs. The DAS of the longest two lifetimes (blue and magenta), representing a mixture of PSI and PSII emission show clear changes upon state transition. To see this figure in color, go online.