
Figure 8.
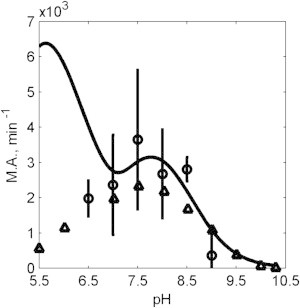
Molecular activity as a function of pH. Experimental data from this study (open circles) are plotted along with experimental data from Raval and Wolfe (29) (open triangles) obtained under identical experimental conditions: [NADH] = 10 μM and [OAA] = 10 μM. Model predictions (Fig. 1F) are plotted (solid line). The model predicts a peak at low pH (pH ∼6), contradicting the experimental data observations.