
Figure 2.
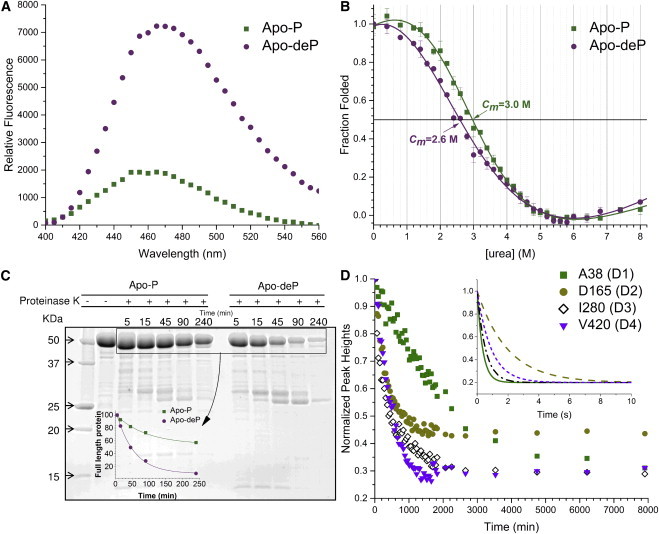
Phosphorylation effects on the accessibility and stability of PMM/PGM. (A) ANS emission spectra with Apo-P and Apo-deP. (B) Apo-P and Apo-deP were denatured by incubation in urea for 12 h at 25°C in 50 mM MOPS, pH 7.4, and 0.1 mM DTT. The intrinsic Trp fluorescence at each point was measured in duplicate. (C) Effect of proteinase K on Apo-P and Apo-deP. Aliquots were removed at the indicated times and monitored with SDS-PAGE. The inset plots the decay of the intact enzyme. (D) Examples of an amide group in each domain with HX slowed by phosphorylation. The disappearance of an amide peak of each domain from TROSY spectra upon a change of Apo-P to D2O solution is plotted. The inset shows subsecond components of HX simulated using the rate constants fitted to CLEANEX time courses for the same four residues in the Apo-deP form (Fig. S1). To see this figure in color, go online.