
Figure 4.
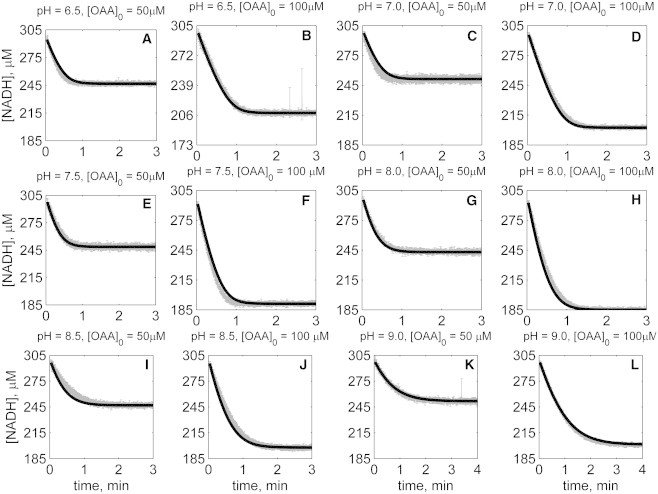
Time-course data in the reverse direction (NADH oxidation) at various pH values (A–L) with 1 mM NAD as product inhibitor present in the initial buffer. Initial conditions are [NADH]0 = 300 μM, [NAD]0 = 1 mM, and pH and [OAA]0 represented in the individual plot (in each plot, shaded lines and solid lines, respectively, represent mean with standard deviation of experimentally measured [NADH], and [NADH] obtained from fitting data to ordered bi-bi mechanism; Fig. 1C).