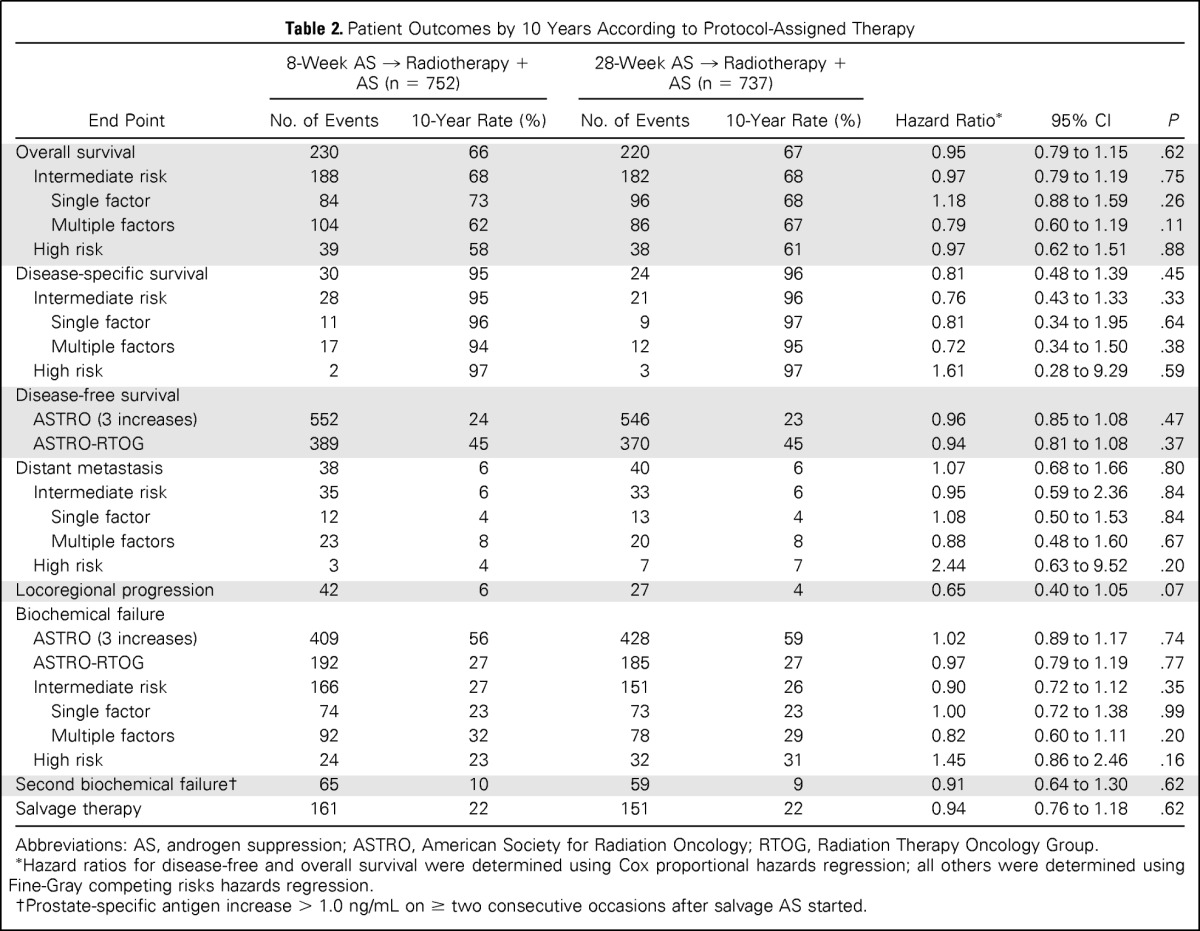
Table 2.
Patient Outcomes by 10 Years According to Protocol-Assigned Therapy

| End Point | 8-Week AS → Radiotherapy + AS (n = 752) |
28-Week AS → Radiotherapy + AS (n = 737) |
Hazard Ratio* | 95% CI | P | ||
|---|---|---|---|---|---|---|---|
| No. of Events | 10-Year Rate (%) | No. of Events | 10-Year Rate (%) | ||||
| Overall survival | 230 | 66 | 220 | 67 | 0.95 | 0.79 to 1.15 | .62 |
| Intermediate risk | 188 | 68 | 182 | 68 | 0.97 | 0.79 to 1.19 | .75 |
| Single factor | 84 | 73 | 96 | 68 | 1.18 | 0.88 to 1.59 | .26 |
| Multiple factors | 104 | 62 | 86 | 67 | 0.79 | 0.60 to 1.19 | .11 |
| High risk | 39 | 58 | 38 | 61 | 0.97 | 0.62 to 1.51 | .88 |
| Disease-specific survival | 30 | 95 | 24 | 96 | 0.81 | 0.48 to 1.39 | .45 |
| Intermediate risk | 28 | 95 | 21 | 96 | 0.76 | 0.43 to 1.33 | .33 |
| Single factor | 11 | 96 | 9 | 97 | 0.81 | 0.34 to 1.95 | .64 |
| Multiple factors | 17 | 94 | 12 | 95 | 0.72 | 0.34 to 1.50 | .38 |
| High risk | 2 | 97 | 3 | 97 | 1.61 | 0.28 to 9.29 | .59 |
| Disease-free survival | |||||||
| ASTRO (3 increases) | 552 | 24 | 546 | 23 | 0.96 | 0.85 to 1.08 | .47 |
| ASTRO-RTOG | 389 | 45 | 370 | 45 | 0.94 | 0.81 to 1.08 | .37 |
| Distant metastasis | 38 | 6 | 40 | 6 | 1.07 | 0.68 to 1.66 | .80 |
| Intermediate risk | 35 | 6 | 33 | 6 | 0.95 | 0.59 to 2.36 | .84 |
| Single factor | 12 | 4 | 13 | 4 | 1.08 | 0.50 to 1.53 | .84 |
| Multiple factors | 23 | 8 | 20 | 8 | 0.88 | 0.48 to 1.60 | .67 |
| High risk | 3 | 4 | 7 | 7 | 2.44 | 0.63 to 9.52 | .20 |
| Locoregional progression | 42 | 6 | 27 | 4 | 0.65 | 0.40 to 1.05 | .07 |
| Biochemical failure | |||||||
| ASTRO (3 increases) | 409 | 56 | 428 | 59 | 1.02 | 0.89 to 1.17 | .74 |
| ASTRO-RTOG | 192 | 27 | 185 | 27 | 0.97 | 0.79 to 1.19 | .77 |
| Intermediate risk | 166 | 27 | 151 | 26 | 0.90 | 0.72 to 1.12 | .35 |
| Single factor | 74 | 23 | 73 | 23 | 1.00 | 0.72 to 1.38 | .99 |
| Multiple factors | 92 | 32 | 78 | 29 | 0.82 | 0.60 to 1.11 | .20 |
| High risk | 24 | 23 | 32 | 31 | 1.45 | 0.86 to 2.46 | .16 |
| Second biochemical failure† | 65 | 10 | 59 | 9 | 0.91 | 0.64 to 1.30 | .62 |
| Salvage therapy | 161 | 22 | 151 | 22 | 0.94 | 0.76 to 1.18 | .62 |
Abbreviations: AS, androgen suppression; ASTRO, American Society for Radiation Oncology; RTOG, Radiation Therapy Oncology Group.
Hazard ratios for disease-free and overall survival were determined using Cox proportional hazards regression; all others were determined using Fine-Gray competing risks hazards regression.
Prostate-specific antigen increase > 1.0 ng/mL on ≥ two consecutive occasions after salvage AS started.
