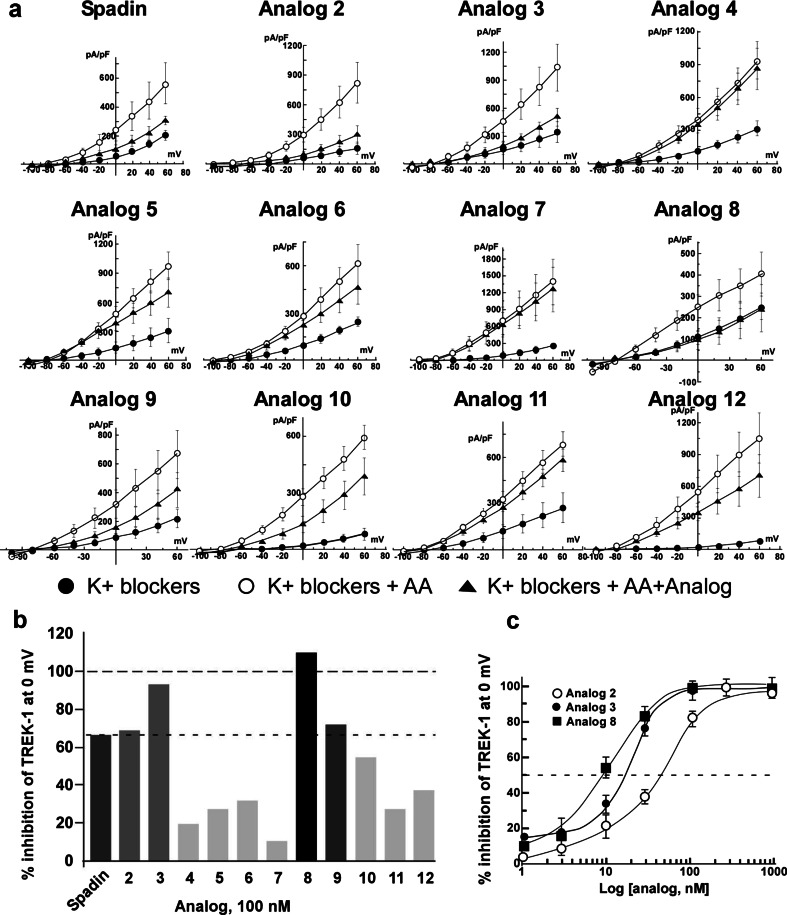
Fig. 2.
I–V curves of spadin and its analogs. All experiments were performed on h-TREK-1/HEK cell line in the presence of a mixture of K+ channels blockers and by using the whole cell configuration of the patch clamp technique. a Control currents (black-filled circles, K+ blockers) were amplified by the application of 10 μM of arachidonic acid (white-filled circles, K+ blockers + AA). After application of 100 nM of spadin or its analogs, remaining currents were measured (black-filled triangles, K+ blockers + AA + spadin or analog). b Percentage of inhibition of the TREK-1 current measured at 0 mV obtained by application of 100 nM of spadin and different analogs. c Dose–response curves obtained by measuring the percentage of TREK-1 current inhibition at 0 mV with analog 2 (white-filled circles), analog 3 (black-filled circles), and analog 8 (black-filled squares)

