
Figure 1. The Centrocyte Origins and Alterations to the FL Regulome.
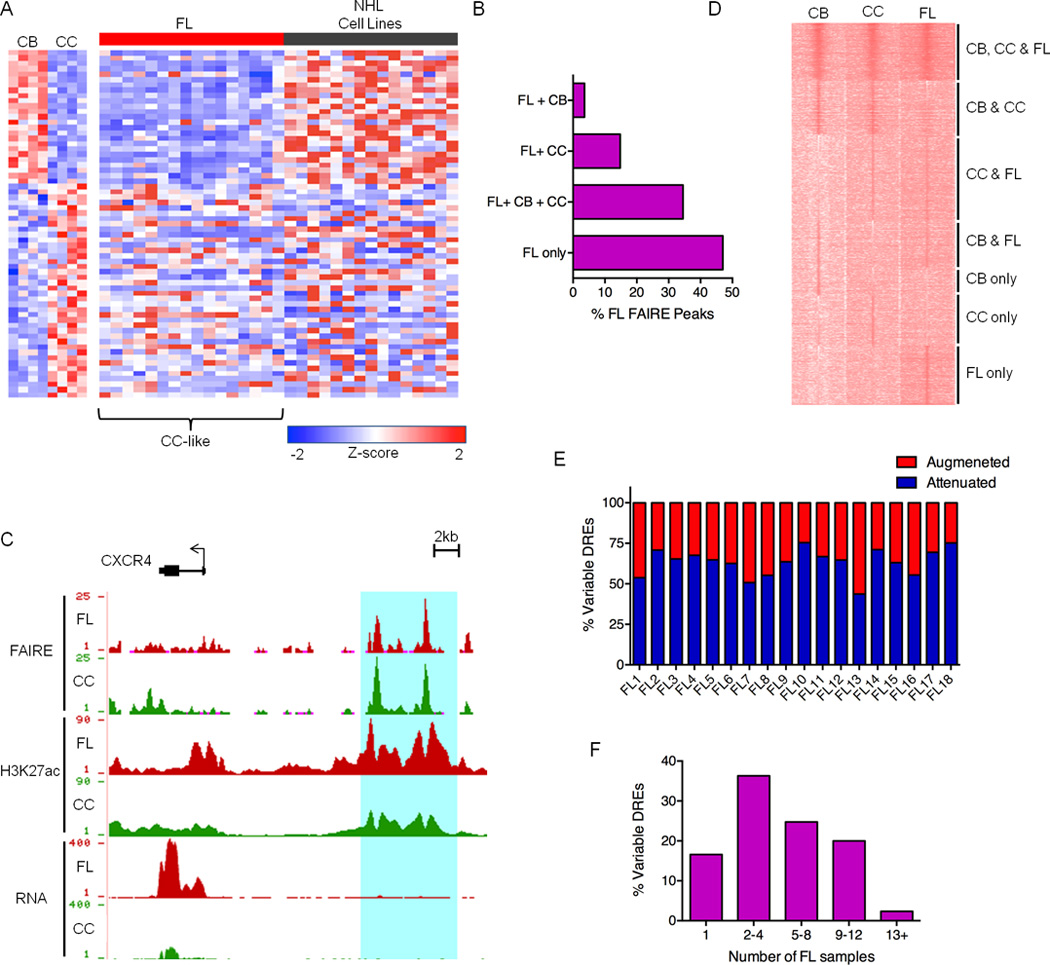
A) Expression profiles of FL and NHL cell lines for a panel of genes differentially expressed in CB versus CC. B) Bar graph showing unique and shared FAIRE peaks in FL and GC-B cell populations. C) UCSC Genome Browser views of FAIRE-Seq, H3K27ac ChIP-Seq and RNA-Seq data from FL and CC samples, illustrating a collection of DREs located near the CXCR4 gene. FAIRE and ChIP data are presented as number of reads per million mapped reads and plotted on an axis of 1–25 (FAIRE) and 1–90 (H3K27ac). RNA data are presented as number of aligned, in silico extended reads per 10 bp, on a scale of 1–400 reads. D) H3K27ac ChIP-Seq intensities for DREs in representative CB, CC, and FL samples. Data are presented as k-means clustering of tag densities per 200 bp within a window of 10 kb around the DREs. E) Percent of variable DREs with ≥ 2-fold increase (augmented) or decrease (attenuated) in FAIRE-seq, H3ac ChIP-seq or H3K27ac ChIP-seq signal for FL samples relative to CC. F) Recurrence rates of variable DREs depicted by proportion detected in number of FL samples.