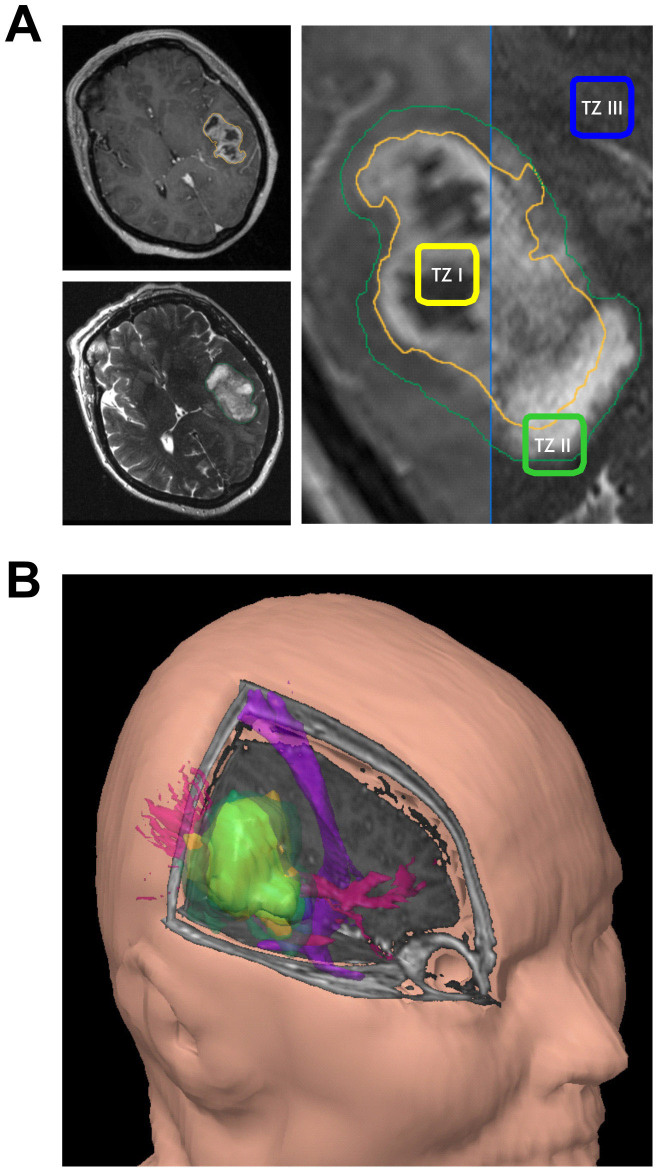
Figure 1. Visualization of differential tumor zones with respect to functionally eloquent areas of the brain.
(A), T1 and T2 weighted MR images of a right temporo-dorsal GBM, fused in order to delineate the various tumor zones (TZ): TZ I – corresponding to contrast agent enhancing areas, TZ II – corresponding to the perifocal edema, TZ III – corresponding to apparently healthy brain parenchyma. (B), three dimensional representation of the same tumor in relation to anatomically relevant fiber tracts (pink: optic radiation, purple: pyramidal tract).

