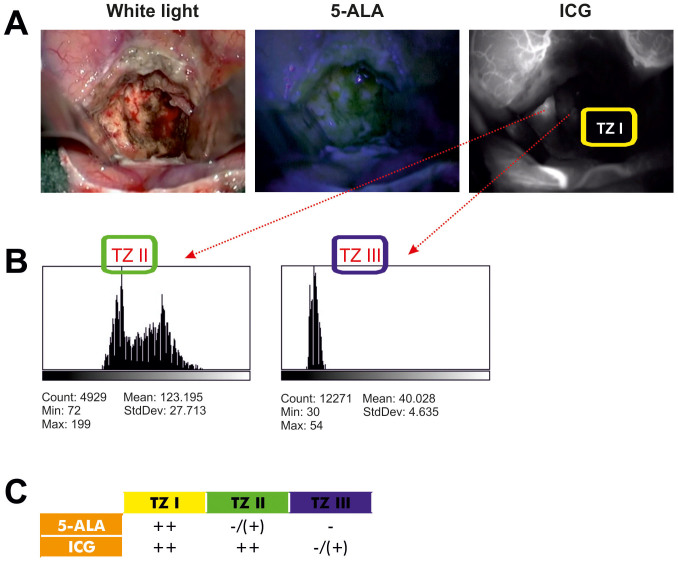
Figure 2. Intraoperative visualization of the tumor zones.
(A), The image on the left depicts the tumor cavity following gross total resection in white light. The image in the middle depicts systematic inspection of the same tumor cavity under blue light (5-ALA). The image on the right depicts an area of hypervascularization according to ICG fluorescence angiography in the same tumor cavity where no 5-ALA signal was detectable. (B), Analysis of the intensity of the fluorescence using the open source software ImageJ of the National Institutes of Health. It is clearly seen that sharp increase in fluorescence effectively unmasks the TZ II, whereas TZ III is characterized by drastically reduced fluorescence intensity. (C), We used the following algorithm to differentiate between the three tumor zones: TZ I is 5-ALA and ICG positive, TZ II is 5-ALA negative or weakly positive and ICG positive, TZ III is 5-ALA negative and ICG negative.

