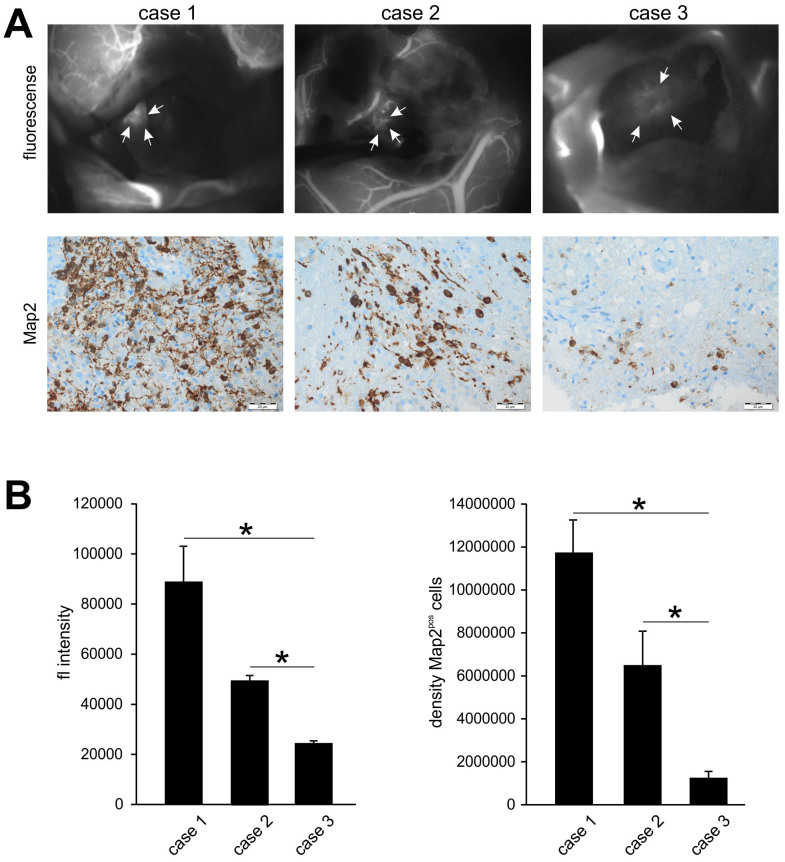
Figure 3. Correlation of ICG positive areas with tumor cell density.
(A), The images depict the three cases operated on which the ICG angiography was carried out and the corresponding levels of tumor cell density (Map2) in the positive areas. The extent of Map2 expressing cells showed positive correlation with the intensity of the ICG signal. (B), The graphs depict quantification of the intensity of ICG fluorescence and Map2 signal. Statistical significance was calculated with the Student's t-test (mean ± S.D., *P < 0.05, n = 3 measurements per group).

