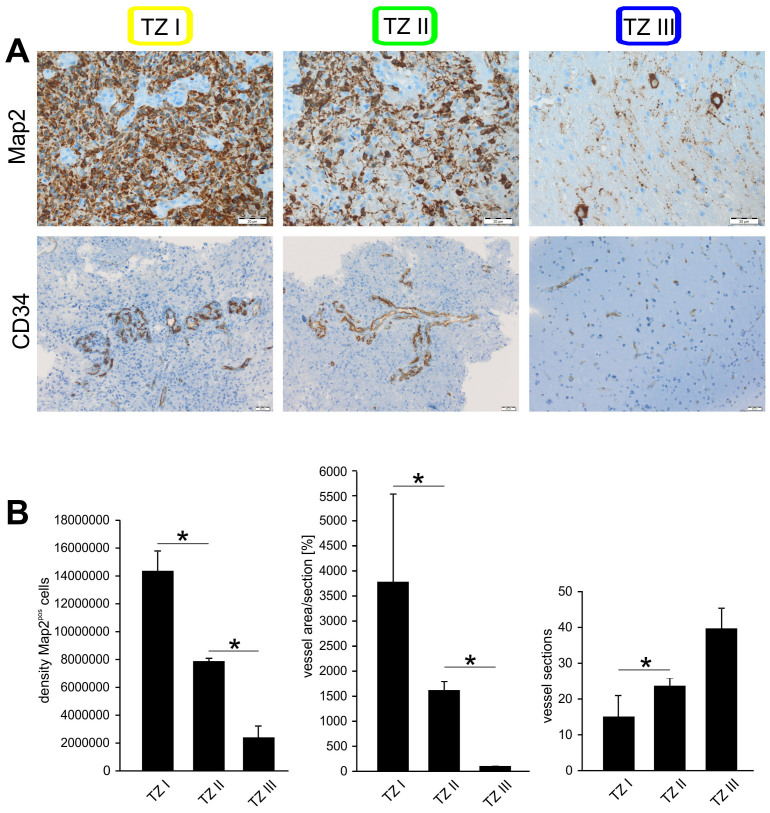
Figure 4. Correlation between Map2 and CD34 expression in the three tumor zones.
(A), Patients specimens from the three tumor zones were analyzed with antibodies against Map2 for tumor cell density and CD34, an endothelial marker, for vascular architecture. A marked difference in Map2-staining could be seen between all three tumor zones with decreasing tumor cell density with increasing distance from the center of the main tumor mass, a fact well correlated by investigation of the vascular architecture using CD34 immunohistochemistry. (B), Graphic quantification of the Map2 signal and vascular architecture of the three tumor zones. Although TZ I showed lower vascular density, the vessels appeared significantly thicker than in TZ II and TZ III. Although TZ II showed more vascular sections and narrower vessels than in TZ I, they were more densely packed than in TZ III. Statistical significance was calculated with the Student's t-test (mean ± S.D., *P < 0.05, n = 3 measurements per group).

